What is the Producer Price Index (PPI)?
The Producer Price Index (PPI) is a measure of the average change in the prices received by domestic producers of goods and services. It is a leading indicator of inflation and reflects the cost pressures faced by businesses. The PPI covers various sectors of the economy, such as manufacturing, mining, agriculture, and utilities.
At CANUSA, we keep track of relevant economic categories for industrial facilities, such as piping, valves, fittings, metal products, machinery, and electrical equipment. We use a weighted average of these categories to create the CANUSA Facility Index, which we believe accurately reflects the pricing changes of the industrial facility market in North America.
Producer Price Index – April 2024
The U.S. Bureau of Labor Statistics released the PPI for April 2024, which showed an increase of 2.2% (YoY) from the same month last year.
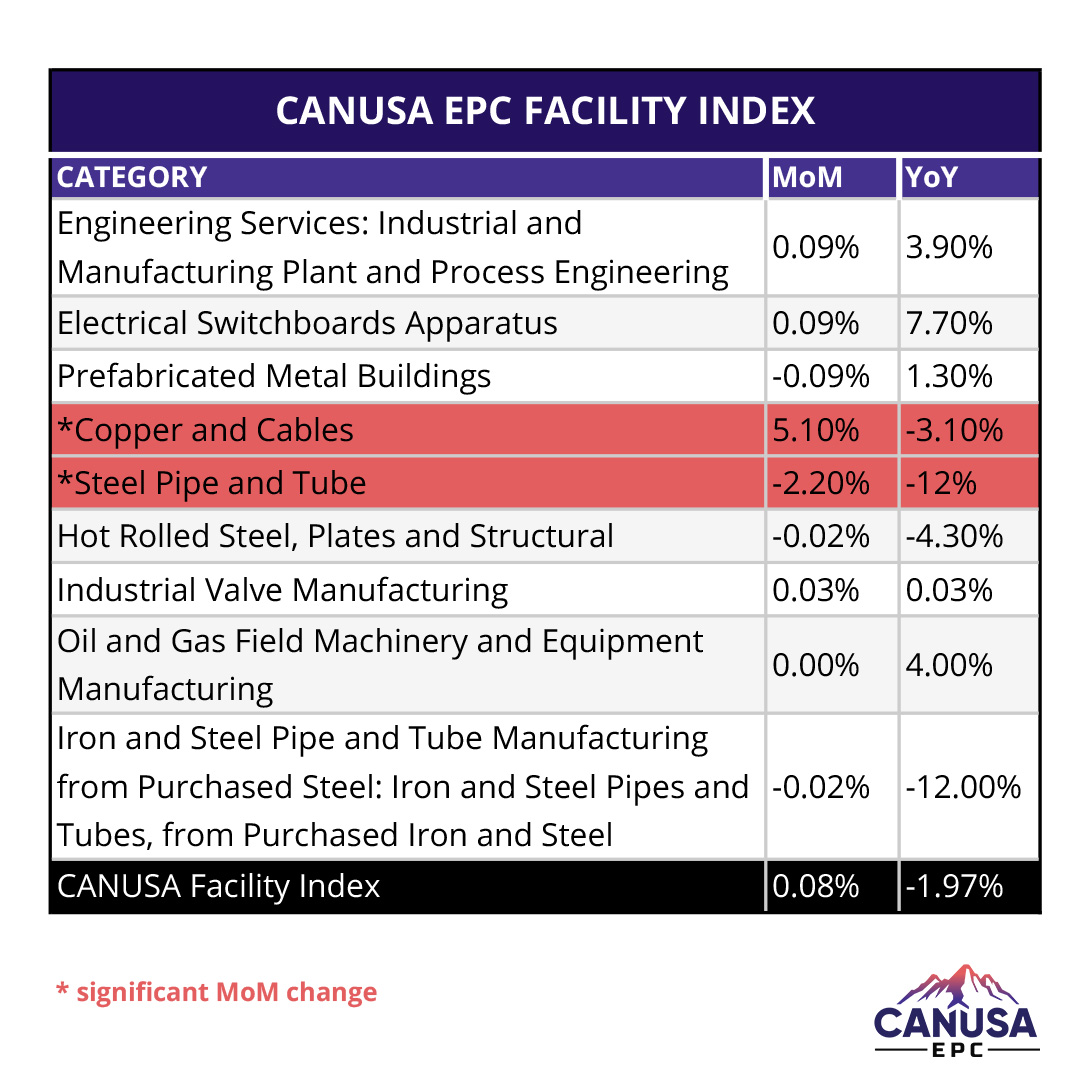
Below are the month-over-month and year-over-year changes for our key categories, based on the data from the St. Louis Fed.
Piping and manufacturing is continuing to keep the CANUSA Facility Index down year-over-year, recording a –1.97% change from last April.
This is mainly due to the excess capacity and lower demand for oil and gas products, which are the main drivers of piping and manufacturing activity. Electrical equipment continued to increase this month and we see this trend continuing.
CONNECT WITH CANUSA EPC
The CANUSA Facility Index is a valuable tool for our clients and partners, as it helps them monitor the market conditions and plan their projects accordingly. We update the index every month, based on the latest PPI data and our own analysis. If you want to learn more about the CANUSA Facility Index, or how we can help you with your industrial facility needs, please contact us.