Resource Type: Blog Posts

  • CO2 Dehydration Study Reduces Project Risk: Injection

    CO2 Dehydration Study Reduces Project Risk: Injection

    Excess water in CO2 streams can lead to severe project risks, including equipment failure, blocked pipelines, and compromised system integrity. Without accurate data and a clear strategy, saturated CO2 can cause significant operating challenges. Technology selection during a CO2 injection project impacts profitability, safety, and longevity. A comprehensive CO2 dehydration study is the key to preventing these risks. It provides the clarity you need to make informed technology decisions, ensuring your operations remain safe, reliable and efficient.

    The Hidden Threat of Water in CO2 Streams

    Excess water in CO2 streams poses significant risks, including:

    • Pipeline Corrosion:

      Water reacts with CO2 to form carbonic acid, which can rapidly erode infrastructure.
    • Hydrate Formation:

      Under high-pressure conditions, water can crystallize, causing blockages that disrupt operations.
    • Reduced Injection Efficiency:

      High water content undermines injection reliability, leading to expensive maintenance and unplanned downtime.

    Water content targets typically range from 10 ppm to 50 lb/MMscf, depending on your transportation strategy, materials selection, and injection goals. For projects involving long pipelines or stringent injection requirements, managing water content isn’t optional—it’s essential.

    engineers reviewing dehydration study

    Why a Dehydration Study Is Your Vital First Step

    The right dehydration study transforms uncertainty into clarity. It will provide actionable insights to guide your project and give you confidence with decision-making.

    Here’s how:

    1. Define Project Objectives and Constraints:
      • Document your project’s goals, specifications, and concerns. A clear starting point ensures alignment across project teams.
    2. Understand the Composition of your Gas Stream:
      • Analyze the composition of your CO2 stream, identifying contaminants that may affect dehydration technology performance.
    3. Clear Evaluation of Dehydration Technology Options:
      • Compare technologies based on CapEx, OpEx, operability, and scalability. Focus on solutions that align with your team’s expertise and long-term project needs.
    4. A Transparent and Unbiased Analysis:
      • Selecting dehydration technology often involve trade-offs between cost, efficiency, and future expandability. A comprehensive study gives you the confidence to choose the right solution without surprises.

    Comparing CO2 Dehydration Technologies

    Selecting the right technology depends on your project’s specific needs. A breakdown of common options is below:

    • Glycol Absorption Dehydration using Tri-Ethylene Glycol (TEG):
      • One of the most common technology suitable for many projects.
      • Requires additional modifications to achieve ultra-low water content.
      • Larger footprint and higher maintenance demands.
    • Desiccant Adsorption Systems:
      • Achieves extremely low water content, ideal for stringent requirements.
      • Higher upfront costs due to desiccant materials.
      • Ideal for projects with ultra-low water content targets.
    • Semi-Permeable Membranes:
      • Advanced systems offering high efficiency.
      • Require gas pre-treatment and higher inlet pressures, increasing upfront investment.
      • Ideal for projects needing minimal removal.
    • Chiller/Refrigeration Systems:
      • Uses dew point control to condense water from the vapor phase to a liquid.
      • Options like DEXPro leverage innovative solutions for energy-efficient cooling.
      • Effective for moderate water removal but with limitations on extreme requirements.

    * Detailed characteristics have been compiled for each of these technologies and are available for review by downloading the full dehydration paper.
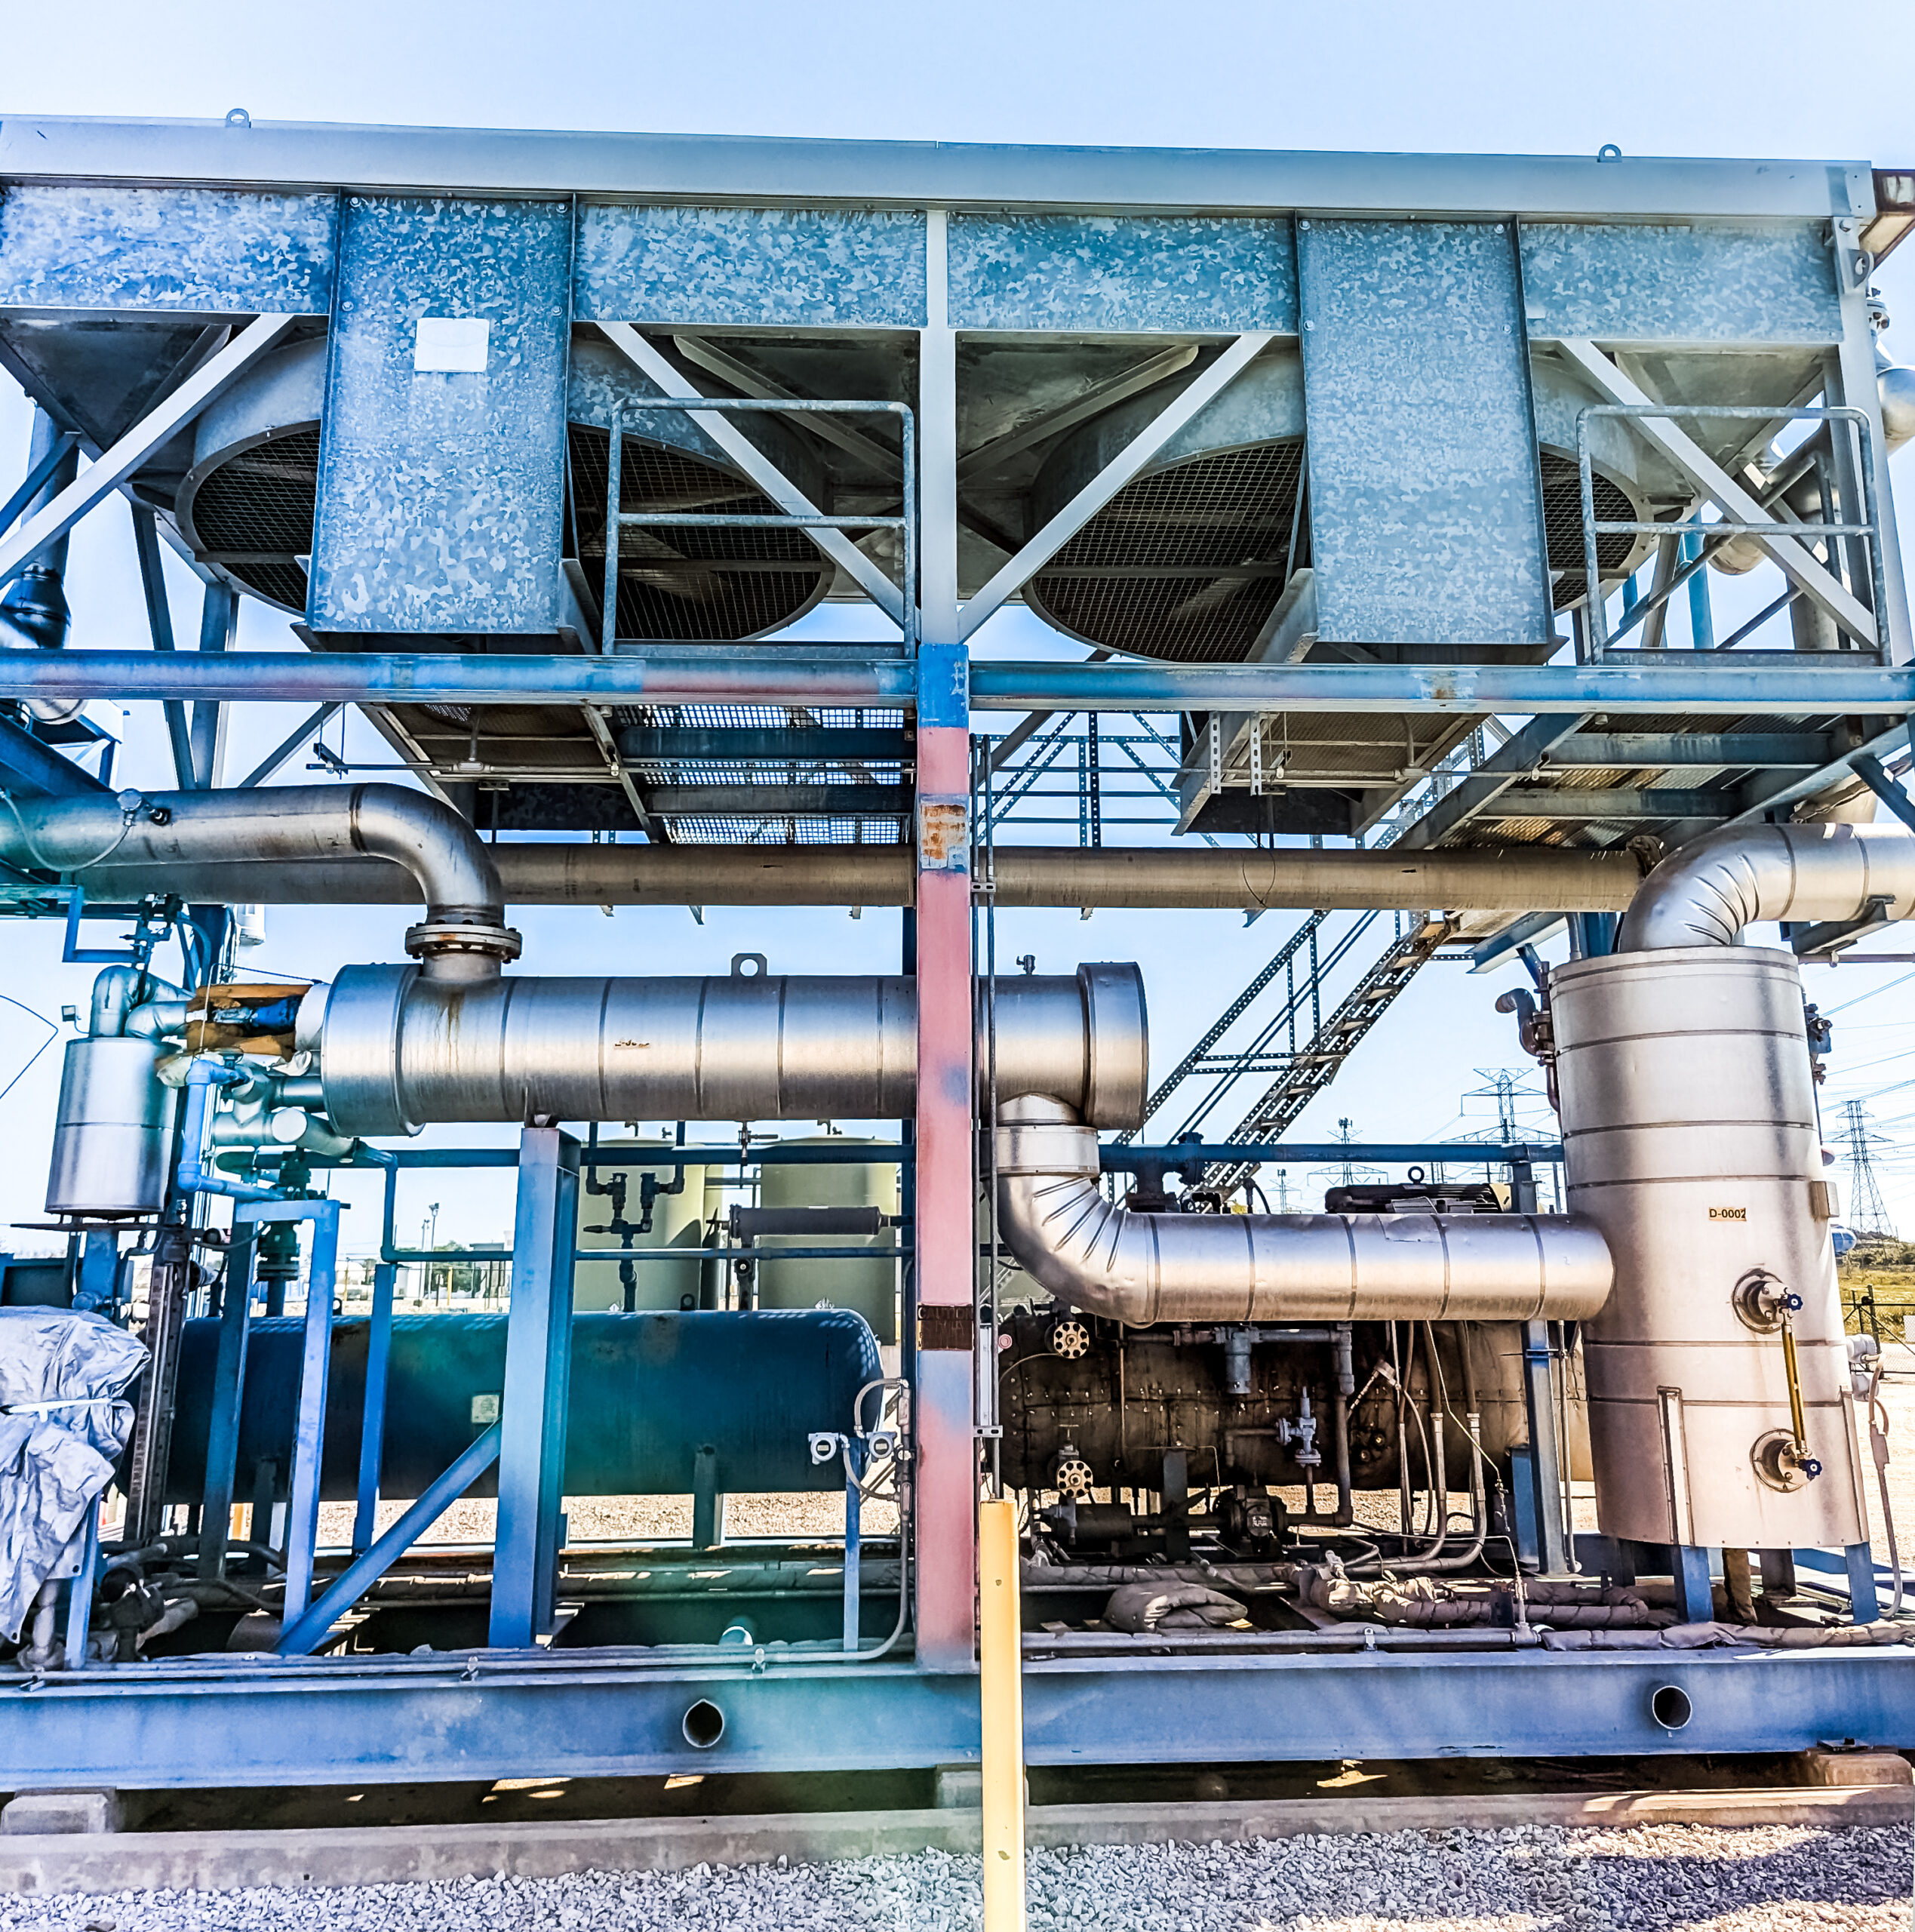
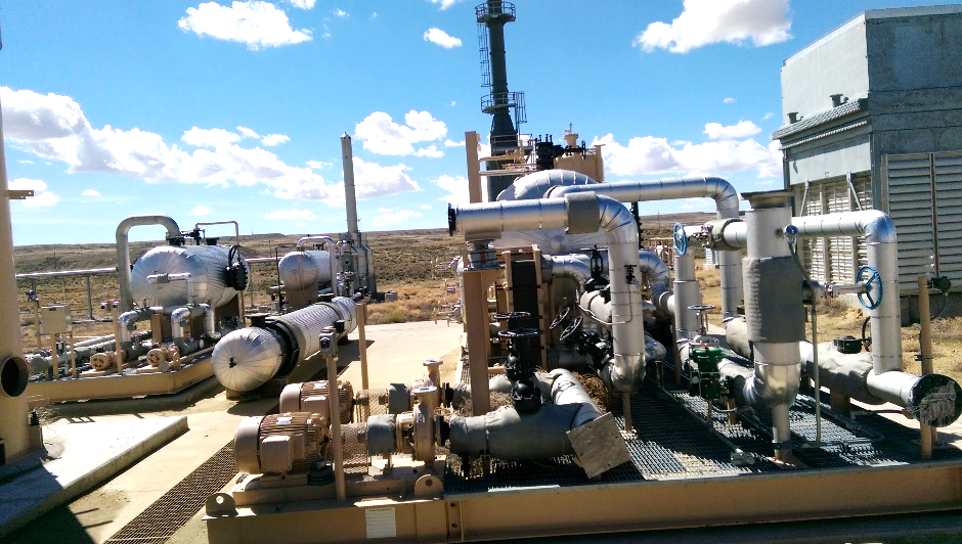
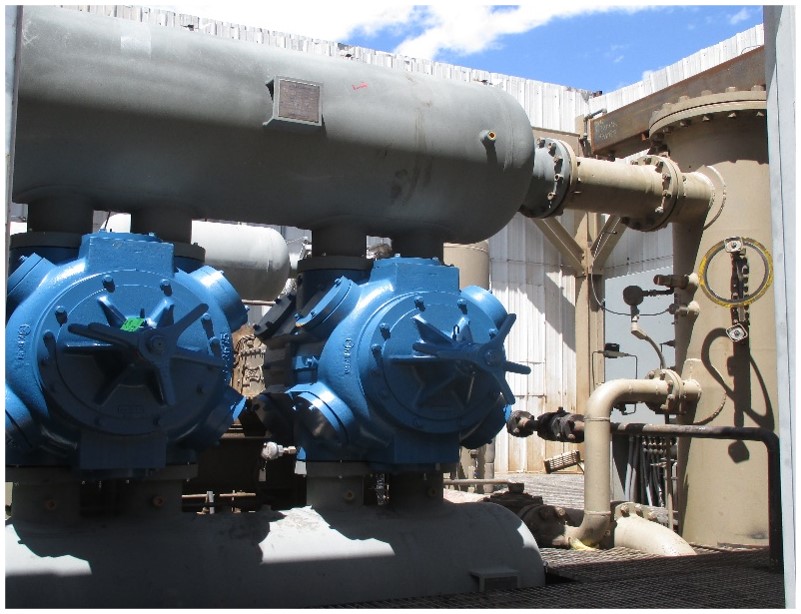
    oil and gas dehydration equipment

    Real-World Success: Evaluation Findings for CO2 Dehydration

    In a recent CO2 injection project, CANUSA EPC was asked to evaluate dehydration options for reducing water to a 25 lb limit in the gas stream prior to injection.

    The framework of their evaluation can be considered a minimum viable standard for dehydration analysis.

    • Reliability
    • Uptime
    • CapEx and OpEx
    • Safety
    • Schedule Risk
    • Operability/Ease of Maintenance
    • Stakeholder Support
    • Environmental Impact
    • Expansion Potential

    The following dehydration solutions were evaluated to determine which technology would best meet the client’s requirements:

    • Traditional TEG
    • Chiller Package
    • Integrated DEXPro solution

    The result?

    *A detailed comparison table is available for review by downloading the full dehydration paper.

    In this client’s case, DEXPro stood out for its integration capabilities, environmental efficiency, and alignment with the client’s sustainability goals.
    Download the Full Paper on CO2 Injection & Dehydration:

    Access the comparison of key technologies presented in this article by downloading CANUSA EPC’s paper.

    Click here to download: Maximize Efficiency & Reliability in CO2 Injection

    Embarking on a CO2 injection project without a dehydration study is like flying blind. Start with this critical step and ensure the dehydration study follows the framework within the paper – before assembling your project team.

    PAPER AUTHORS: 
    Tevin Champagne, Project Manager
    Connect on LinkedIn

    Josh Hoeft, Project Manager
    Connect on LinkedIn

    Nick Brown, Project Engineer
    Connect on LinkedIn

    Ted Zeiger, PE,  Project Engineering Lead
    Connect on LinkedIn


  • Repurposing Oil & Gas Equipment: A Cost-Effective Solution?

    Repurposing Oil & Gas Equipment: A Cost-Effective Solution?

    Energy projects face shrinking budgets and tighter timelines. Operators, together with their engineering teams, are challenged to find creative cost-reduction solutions without compromising safety or performance.  

    Reusing, relocating, and repurposing oil and gas equipment, is a popular strategy for its cost-effectiveness. Whether placing existing separators into new services or relocating gas compressors and refrigeration units to new fields, this approach can help you meet deadlines and budget constraints. 

    There are many reasons to explore this strategy; however, ‘proceed with caution’ is our overarching advice. There may be instances in which new equipment is still the more reliable and effective solution. 

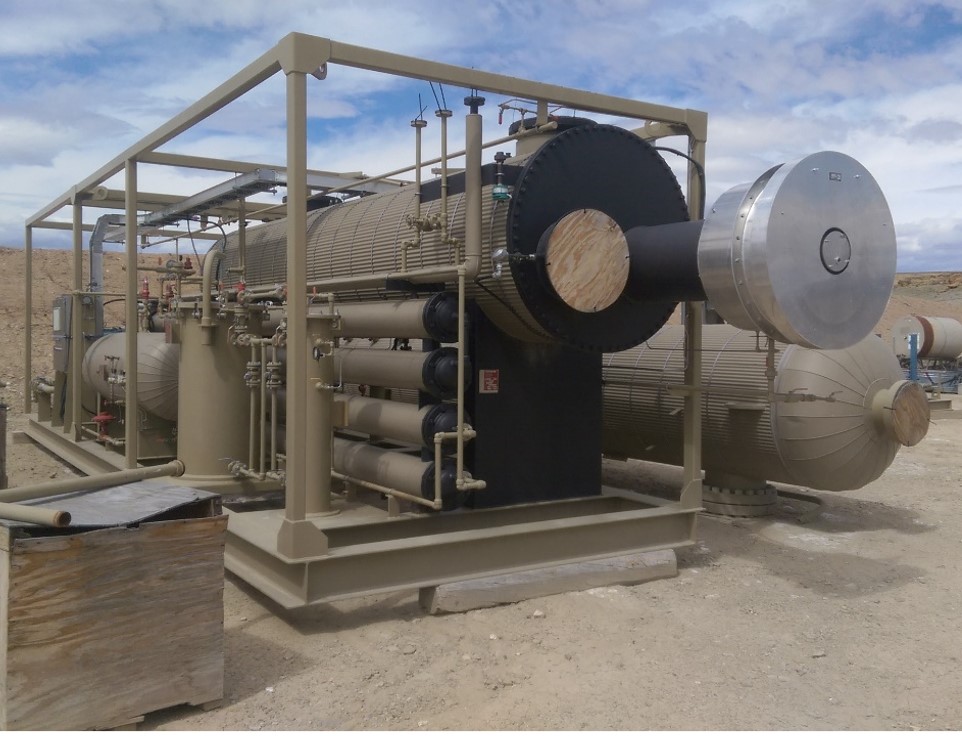
    used equipment on skid

    Benefits of Repurposing Oil and Gas Equipment?

    • Cost Savings:
      Leveraging existing assets can reduce capital expenditure.  This cost savings though if often reduced after include inspection and modification scope for repurposing the equipment.
       
    • Time Efficiency:
      Reused equipment, when available and functional, can often be deployed more quickly than waiting for new orders.
       
    • Sustainability:
      Repurposing equipment aligns with corporate sustainability goals by reducing waste and extending the lifecycle of assets.


    direct fired stabilizer skid

    Key Considerations for Reusing Equipment 

    Governing Codes and Standards
    When repurposing oil and gas equipment, it’s crucial to follow applicable industry standards to ensure safety and performance.  These are some of the most relevant codes: 

    • API 510: Pressure Vessel Inspection Code 
    • API RP 572: Inspection Practices for Pressure Vessels 
    • API 570: Piping Inspection Code 
    • API RP 576: Inspection of Pressure-Relieving Devices 
    • API STD 653: Tank Inspection, Repair, Alteration, and Reconstruction 
    • API STD 579: Fitness-for-Service 

    Compliance with these standards ensures that reused equipment can be safely integrated into new operations. 

    API | Purchase API Standards & Software


    ASME
    In addition to API codes, several other standards must be adhered to, depending on the jurisdiction and specific industry requirements. Organizations must follow all application health and safety regulations.  


    CODES/STANDARDS FOR REUSING EQUIPMENT IN CANADA

    CSA Standards (Canadian Standards Association): 

    • CSA B51: Boiler, Pressure Vessel, and Pressure Piping Code: Governs the construction, installation, inspection, and certification of pressure vessels and piping systems across Canada. 
    • CSA Z662: Oil and Gas Pipeline Systems: Governs the design, construction, operation, and maintenance of pipeline systems in Canada. It’s essential for any relocation or repurposing of gas pipelines and similar systems. 
    • CSA W59: Welded Steel Construction: This is relevant for any welding work needed in repurposing or relocating equipment. 

    Provincial and Territorial Regulations: 

    • Each Canadian province and territory havs its own regulatory body that oversees pressure vessels and related equipment. For example, ABSA (Alberta Boiler Safety Association) in Alberta regulates pressure equipment safety in the province. 


    CODES/STANDARDS FOR REUSING EQUIPMENT IN THE USA

    ASME (American Society of Mechanical Engineers) Codes 

    • ASME Section VIII: Rules for Construction of Pressure Vessels: This code is widely used across the United States and is also accepted in Canada. 
    • ASME B31.3: Process Piping: This applies to piping used in chemical, petroleum, and related industries. 

    National Board Inspection Code (NBIC)

    • A key standard in the United States for the inspection, repair, and alteration of pressure vessels and boilers. 


    CROSS-BORDER COMPATIBILITY

    If equipment is being relocated across borders (e.g., from the U.S. to Canada or vice versa or state-to-state), it’s important to ensure that the equipment complies with the local regulatory standards in the new jurisdiction. 


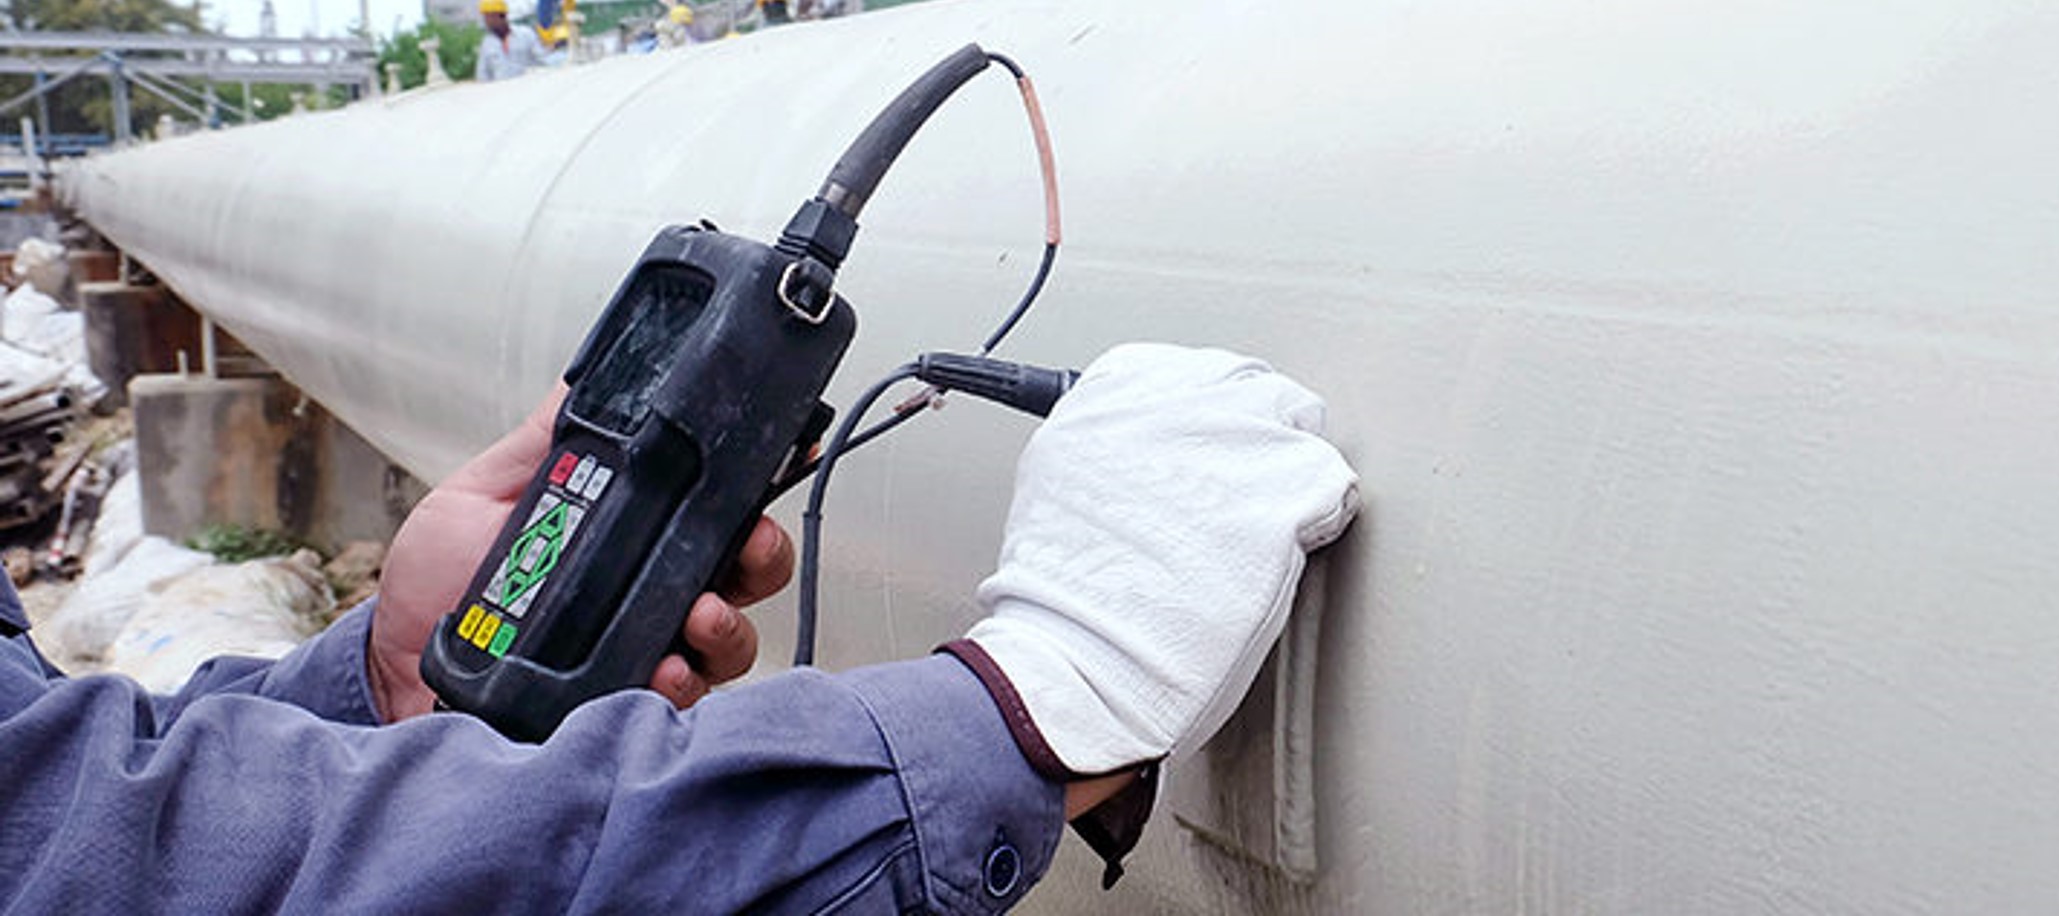
    hand and monitoring device inspecting used equipment

    Inspection Requirements 

    Before deploying any equipment into new service, a thorough inspection is necessary. A detailed inspection plan should be developed based on the equipment’s condition, service history, and the specific requirements of the new application. 

    Key Inspection Elements: 

    • Service History: Understanding the previous operational conditions is critical. Identify signs of corrosion, cracking, blistering, and other types of degradation. Key factors include material thickness, the presence of under-insulation corrosion, and dimensional changes. 
    • Non-Destructive Examination (NDE): Depending on the equipment’s condition, this may include ultrasonic thickness measurements, radiographic inspections, and magnetic particle testing. 
    • Confined Space Entry Requirements: Ensure proper safety protocols are in place, as many inspections may require confined space entry. 
    • Documentation Review: It’s critical to review previous drawings, inspection records, and any reports related to modifications, damage, or repairs. 


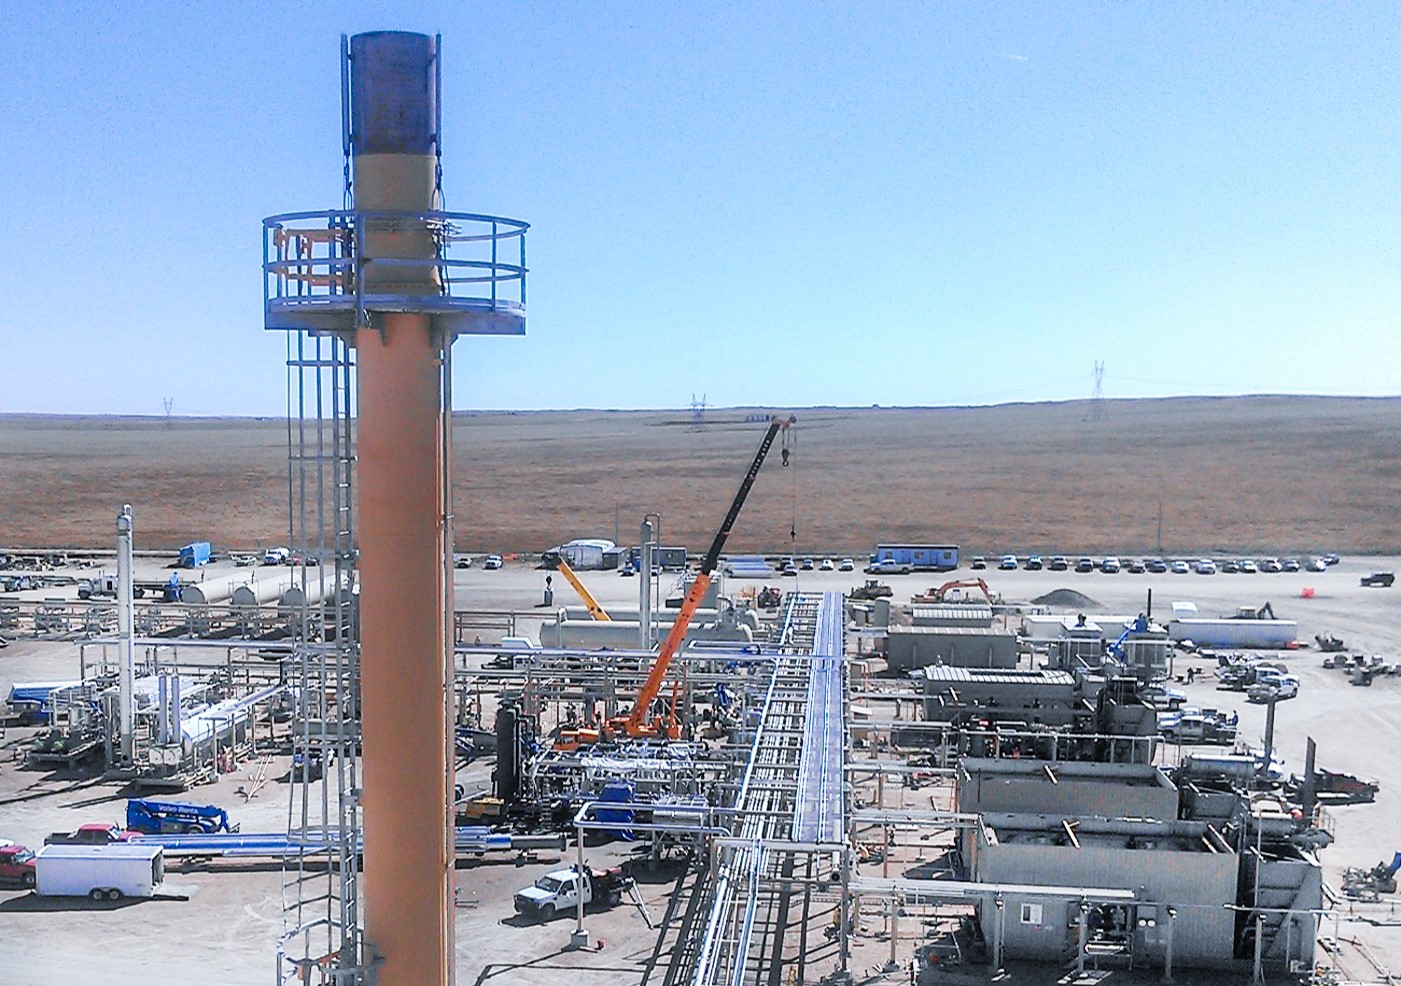
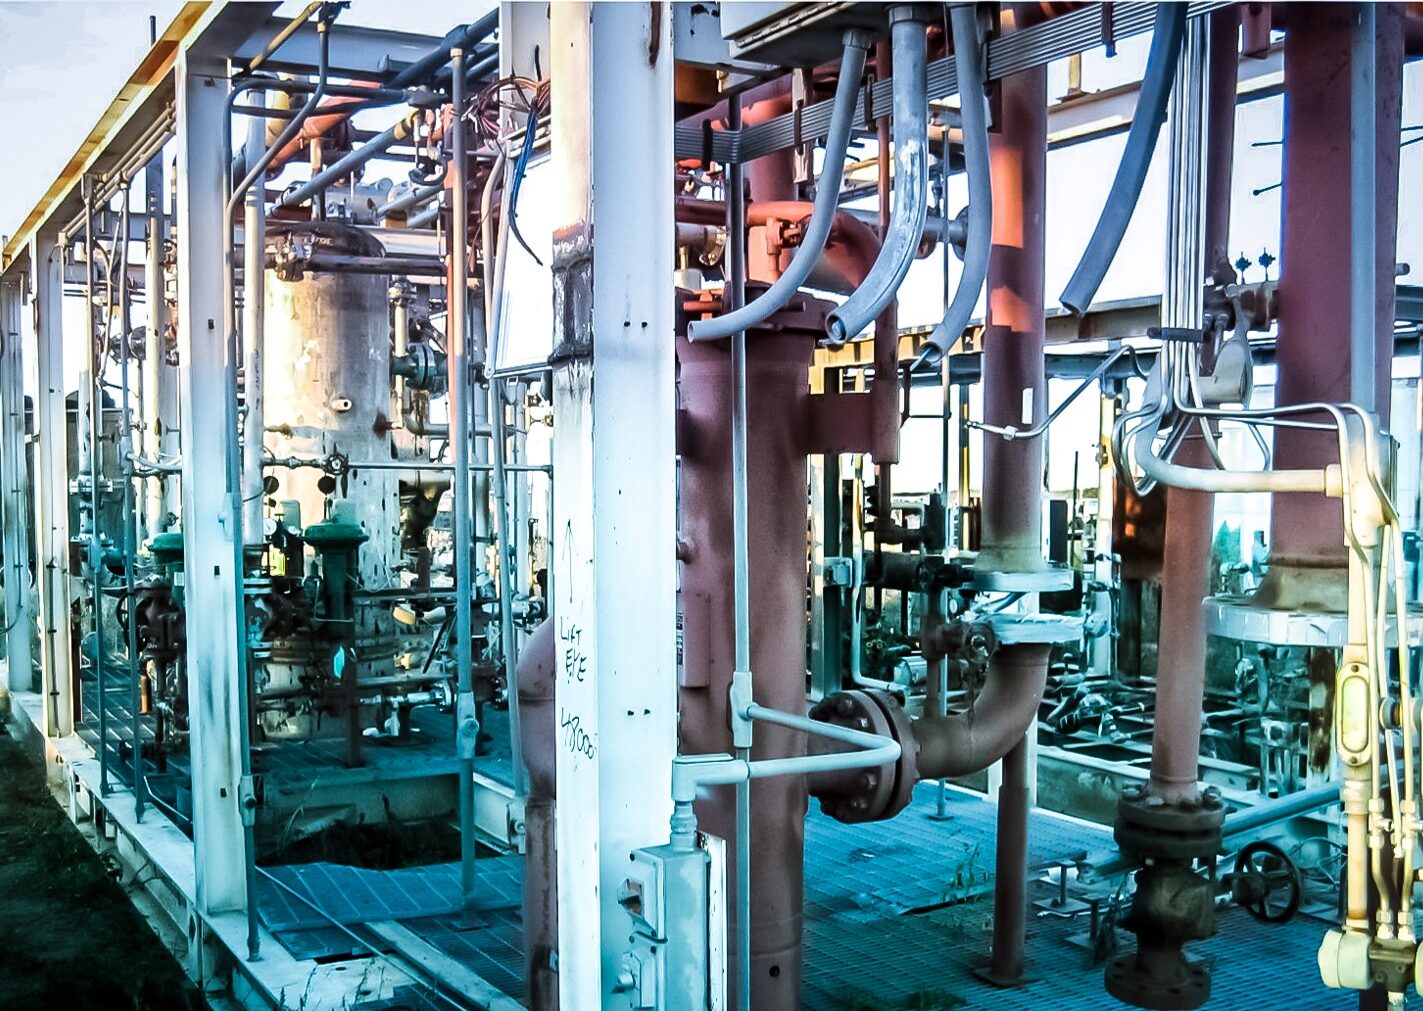
    birds eye view of oil and gas site

    Challenges in Documentation and Material Verification 

    Lack of proper documentation (e.g., missing original equipment drawings or insufficient inspection records) is a significant red flag.  

    For pressure vessels, the ASME Code Section VIII, Division I, UG-10(c) provides guidance for handling unknown materials, but it may lead to conservative assumptions, such as reducing the maximum allowable stress and working pressure. 

    For cryogenic skids, ASME B31.3 (Process Piping) and Section VIII, Division I provide guidance on material selection and stress analysis. When dealing with unknown materials in cryogenic service, you must perform material verification, including testing for low-temperature toughness. If material properties cannot be confirmed, conservative assumptions such as derating the design temperature and applying a lower allowable stress may be necessary, potentially impacting the overall performance and safety of the skid in cryogenic applications. 


    Case Example: When Re-purposing Costs More 

    While repurposing equipment can lead to savings, without the proper pre-evaluation, there is great risk that it could have the opposite effect.  

    Consider a 5,000 bpd stabilizer skid package with an on-skid direct-fired reboiler.  

    Overseen safety concerns necessitate replacing the burner fire tube with a custom electric heater. This modification incurred costs that exceeded the procurement of a traditional reboiler unit. Additionally, shop installation delays pushed the project past the lead time for new equipment. 


    equipment on cryogenic skid

    Is Reused Equipment Always Faster and Cheaper? 

    The benefits of reusing equipment must be weighed against potential downsides, such as: 

    • Modifications that are more expensive than anticipated. 
    • Delays caused by unforeseen repair or upgrade needs. 
    • Documentation issues that result in excessive safety factors and reduced efficiency. 

    In some cases, especially with high-pressure equipment, the savings from repurposing can be significant. However, lower-pressure systems may not justify the additional effort, and purchasing new equipment might be the more cost-effective solution in the long run. 


    bullet vessels on oil and gas site

    How to Be Sure: Inspections for Assessing the Viability of Used Equipment 

    While reusing equipment has clear advantages, in some cases, new equipment may still be the more reliable and effective solution.  

    Your engineering team must be able to clearly identify the risks and rewards of deploying used equipment. A thorough inspection and documentation verification will empower you to make informed decisions about equipment use, while balancing cost, time, and safety. 

    Consider: 

    • Involvement of Engineering Early On:
      Involving engineers in the evaluation process can identify potential risks and help determine whether the repurposed equipment will meet operational requirements.
       
    • Transparent and Clear Documentation/Inspection Findings:
      Without these, the project could face significant delays and/or incur higher costs.
       
    • Creative Solutions:
      Sometimes, existing equipment needs only minor adjustments to function in a new service. These modifications must be balanced against the cost and time of new equipment procurement.


    If you have access to used equipment and are curious of the potential savings – connect with us.
    It is vital to properly assess the risks and rewards!

  • Inflation Reduction Act for CO2 Facilities

    Inflation Reduction Act for CO2 Facilities

    The Inflation Reduction Act (IRA) has been an active policy since August 16th, 2022.  As the law has evolved, navigating this laws requires an understanding of how to structure projects to meet the requirements.  Requirements for Inflation Reduction Act CO2 projects are governed by two sections of the law. 45Q covers the tax policies related to facilities sequestering CO2 and the rebates available to those companies based on how the CO2 is sequestered or used.  Sunset timelines for 45Q are December 31st, 2032.  45Z is related to rebates for low-carbon fuel production, where CO2 capture can be used to reduce the carbon intensity of those fuels for a rebate.  45Z’s timeline is applicable for production between January 1st, 2024 and December 31st, 2027.

    https://home.treasury.gov/policy-issues/inflation-reduction-act/ira-related-tax-guidance
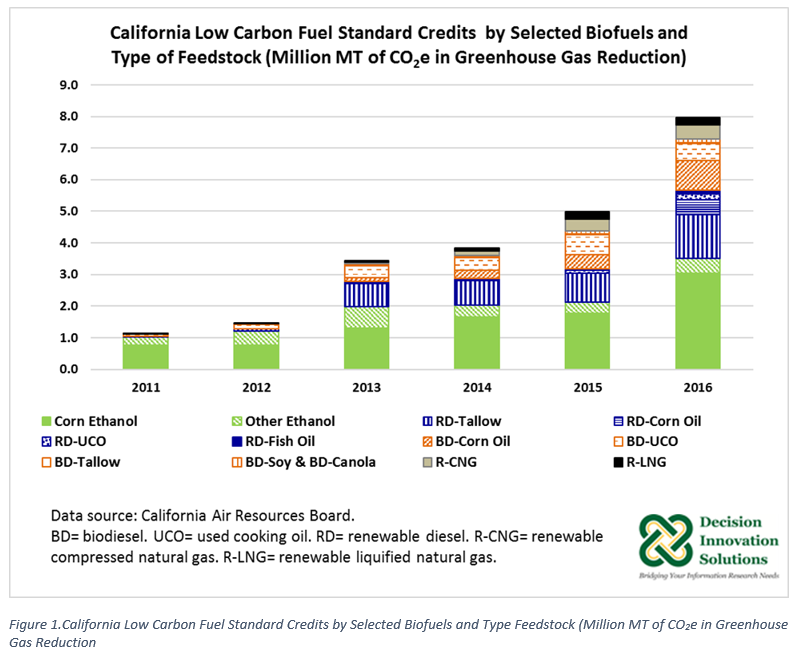
    Graph showing low carbon fuel demand

    Chart provided by Decision Innovation Solutions – July 6th, 2017

    As the industry has sought to utilize these rebates, comments and clarifications have been provided.  We are sharing how some of those clarifications should be considered in your project execution of facilities and products making use of IRA rebates.

    Implications in CO2 Facility Execution for IRA Rebates – 45Q and 45Z

    There are two major factors in requirements for Inflation Reduction Act CO2 projects.  Ensuring that your project considers these requirements and aligns with your contracting strategy for the facility is key to being able to claim the rebates for your project. Meeting these requirements can lead to 5x the rebate from the project, sometimes up to 50% of a project’s capital cost.

    What is the prevailing wage and who governs it?

    The prevailing wage is a locality-based wage measurement tracked by the Department of Labor.

    “A prevailing wage is the combination of the basic hourly wage rate and any fringe benefits rate, paid to workers in a specific classification of laborer or mechanic in the geographic area where construction, alteration, or repair is performed, as determined by the Secretary of Labor in accordance with subchapter IV of chapter 31 of title 40 of the United States Code, also known as the Davis-Bacon Act.”

    https://www.dol.gov/agencies/whd/IRA

    The apprenticeship requirements have increased since the law was signed.

    “Taxpayers shall ensure that, with respect to the construction of any qualified facility, not less than the applicable percentage of the total labor hours of the construction, alteration, or repair work (including such work performed by any contractor or subcontractor) with respect to such facility shall, subject to subparagraph (B), be performed by qualified apprentices.

    In the case of a qualified facility the construction of which begins after December 31, 2023, 15 percent.”

    https://www.law.cornell.edu/uscode/text/26/45#b_8

    Managing Prevailing Wage and Apprenticeship Requirements for the IRA

    Execution strategy can be used to limit exposure and ensure compliance for successful rebates.  Focusing on the definition of a “qualified site” and a secondary site will allow projects to limit the scope that applies to the requirements.  Clarifications to this were provided on June 25th by the Department of the Treasury.

    Welder for Apprenticeship Requirements

    https://www.federalregister.gov/documents/2024/06/25/2024-13331/increased-amounts-of-credit-or-deduction-for-satisfying-certain-prevailing-wage-and-registered

    The structure of the contract terms, including penalty clauses and remediation for the failure to meet and document the requirements should be another focus of the project execution plan.  Secure legal counsel who is familiar with this law and industrial contract negotiations for the review of the contracts.  GrantThorton has some summaries on their website that convey they are experts in the matter and there are many other legal firms out there that can help.

    https://www.grantthornton.com/insights/alerts/tax/2023/flash/irs-details-wage-and-apprenticeship-requirements

    A Path to Successful CO2 Project Execution

    All projects have similar milestones for evaluation, selection, funding, definition, and execution.  During the project evaluation and selection process, discuss the IRA requirements.  At CANUSA EPC, being transparent with the project stakeholders throughout the project allows the team to progress with the execution while staying aligned with the goals of the client.   We don’t claim to provide problem free projects, but we do hold the expectations of our team and clients to work through the problems in a transparent manner.

    Reach out if you have any questions or comments, and we will be happy to provide our expertise to your team.  Project experience from CANUSA EPC related to CO2 can be found at our expertise page.

  • May Producer Price Index Rates – A Surprise Drop

    May Producer Price Index Rates – A Surprise Drop

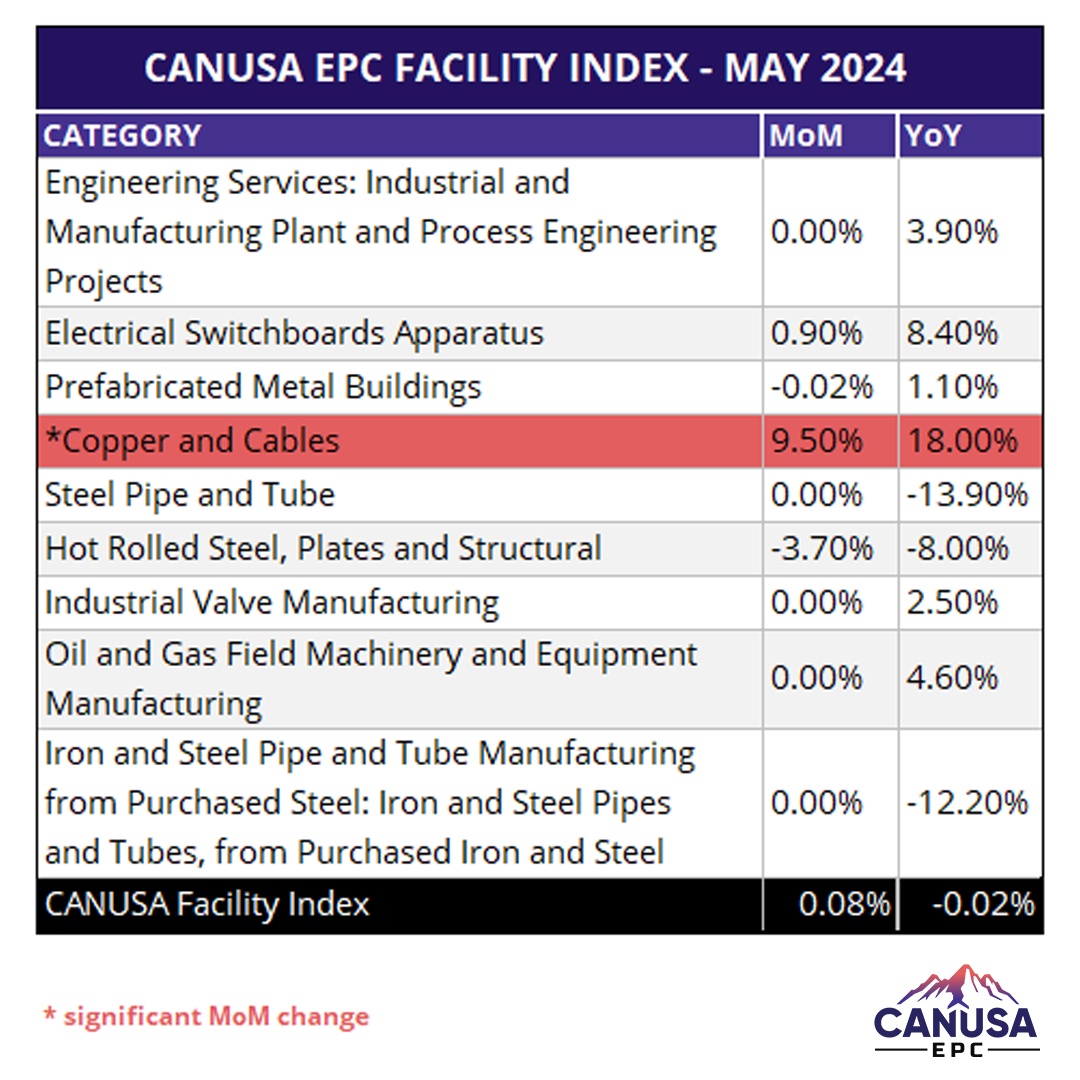
    Producer Price Index (PPI) Rates – May 2024

    The Producer Price Index (PPI) is a measure of the average change in the prices received by domestic producers for their output. It is a key indicator of inflation and cost pressures in the economy. The PPI for May 2024 fell by an unexpected 0.2% month-over-month (MoM), compared to an increase of 0.5% that was expected by economists. This was the first decline in the PPI since December 2023, and it was mainly driven by lower prices for energy and food products.

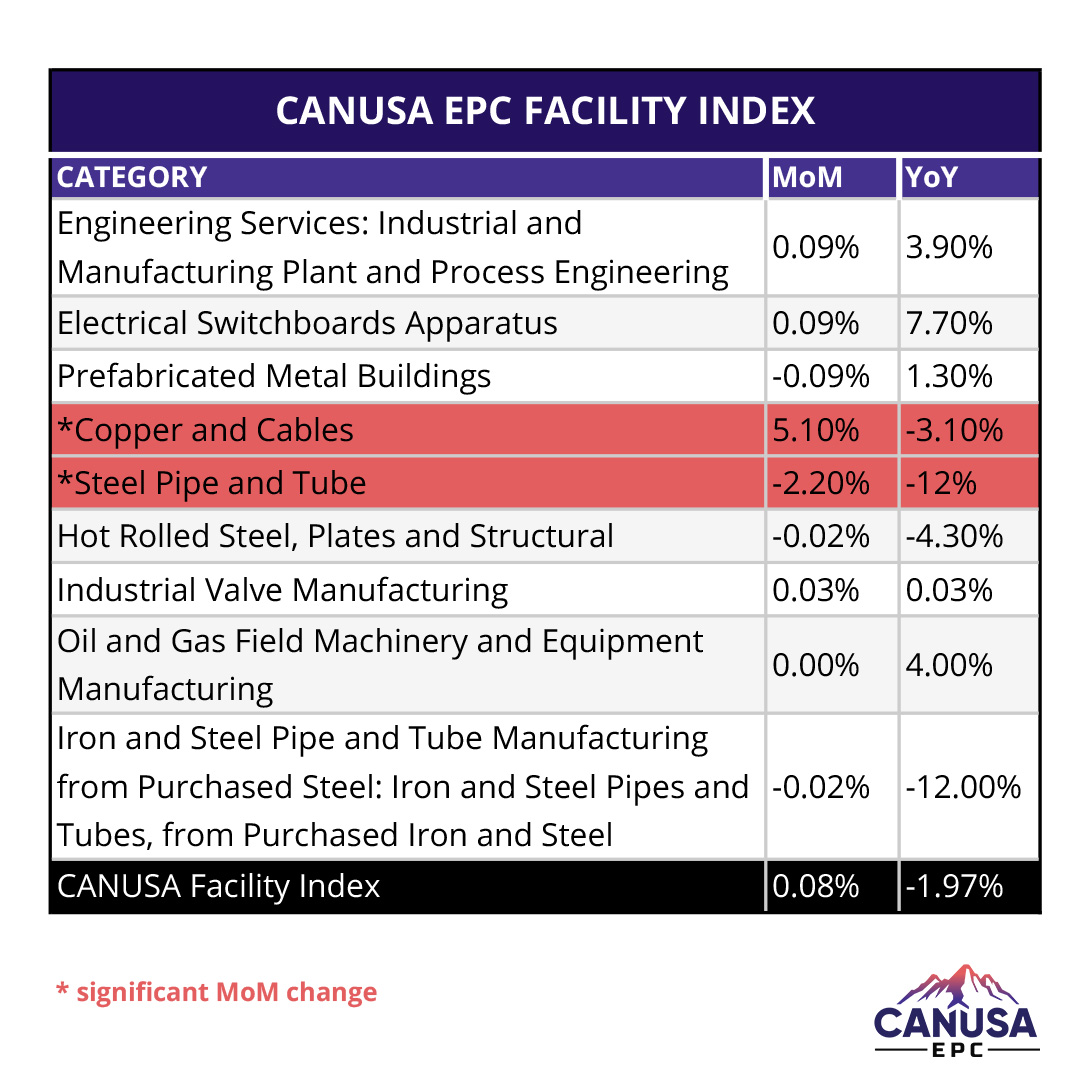
    Below is a breakdown of pricing we follow and our Facility Index, prices for industrial facilities were largely flat Month over Month.


    CONNECT WITH CANUSA EPC 

    The CANUSA Facility Index is a valuable tool for our clients and partners, as it helps them monitor the market conditions and plan their projects accordingly. We update the index every month, based on the latest PPI data and our own analysis. If you want to learn more about the CANUSA Facility Index, or how we can help you with your industrial facility needs, please contact us at info@canusaepc.com.

  • Lower Facility Electrical Costs with VFDs: A CO2 Liquefaction Case Study

    Lower Facility Electrical Costs with VFDs: A CO2 Liquefaction Case Study

    Why is Electric Drive Technology Important?

    CO2 capture and liquefaction is a process that converts gaseous carbon dioxide into liquid form, which can then be stored or transported for various applications. CO2 capture and liquefaction is an important technology for reducing greenhouse gas emissions and meeting lower carbon products. However, CO2 capture and liquefaction also require a significant amount of energy, especially for the compression of CO2 gas.  Therefore, it is important pick the proper drive and compression technology to manage the “parasitic load” associated with processing the CO2.

    Screw compressors are widely used in CO2 liquefaction and capture facilities, as they can handle large volumes of gas and are common in refrigeration loops for the liquefaction process. Screw compressors typically use slide valves for unloading and capacity control, which adjust the internal volume of the compressor to match the process demand. However, using slide valves does not reduce the power requirements of the compressor as much as reducing the speed of the compressor would. Therefore, at reduced throughput, using variable frequency drives (VFDs) to control the speed of the screw compressors compared to slide valves provides lower energy usage.

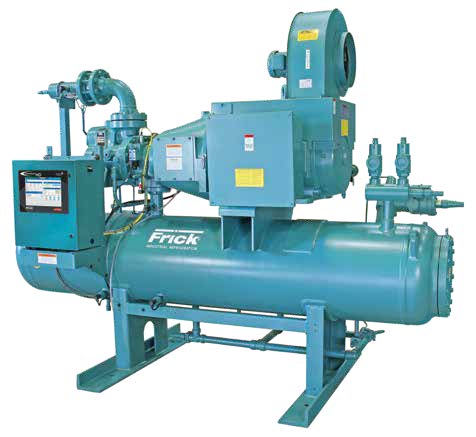
    hps 42 compressor package

    Img Source: Johnson Controls

    Evaluating Screw Compression at CO2 Liquefaction Facility

    In this analysis, we will present a case study of a 1000 metric ton per day (MTPD) CO2 liquefaction facility that used screw compression as the main driver and for cooling of the process. We will compare the performance and energy consumption of the screw compressors using slide valves and VFDs and show how VFDs can offer significant benefits in terms of:

    • efficiency,
    • reducing operating costs,
    • and providing a lower carbon intensity for the ethanol product.

    We analyzed the data of a 1000 MTPD CO2 liquefaction facility that used electric driven screw compressors for the main compression and cooling stages of the process. The facility had a total of ~6500 kW of screw compressor load, consisting of three main compressors and 3 cooling compressors. The main compressors were designed to compress CO2 gas, and the cooling compressors were designed to provide refrigeration for the process.

    Methodology: Comparing Slide Valves & VFDs

    We compared the performance and energy consumption of the screw compressors using two different methods of capacity control: slide valves and VFDs.

    1. Slide valves are mechanical devices that change the internal volume of the compressor by sliding a valve along the rotor, thus varying the amount of gas that enters the compression chamber.
    2. VFDs are electronic devices that change the frequency and voltage of the electric supply to the compressor motor, thus varying the speed of the compressor.

    We assumed that the facility is operating at 75% of its design capacity, which is a possible scenario for CO2 liquefaction and capture facilities based on the cycling that happens with fermentation.

    We also estimated the capital cost and the operating cost of the screw compressors using slide valves and VFDs. For using slide valves, it was assumed that the compressors would be started with soft-starts. We assumed that the operating cost of the screw compressors was mainly determined by the electricity cost, which was $0.13 USD per kWh.

    Results

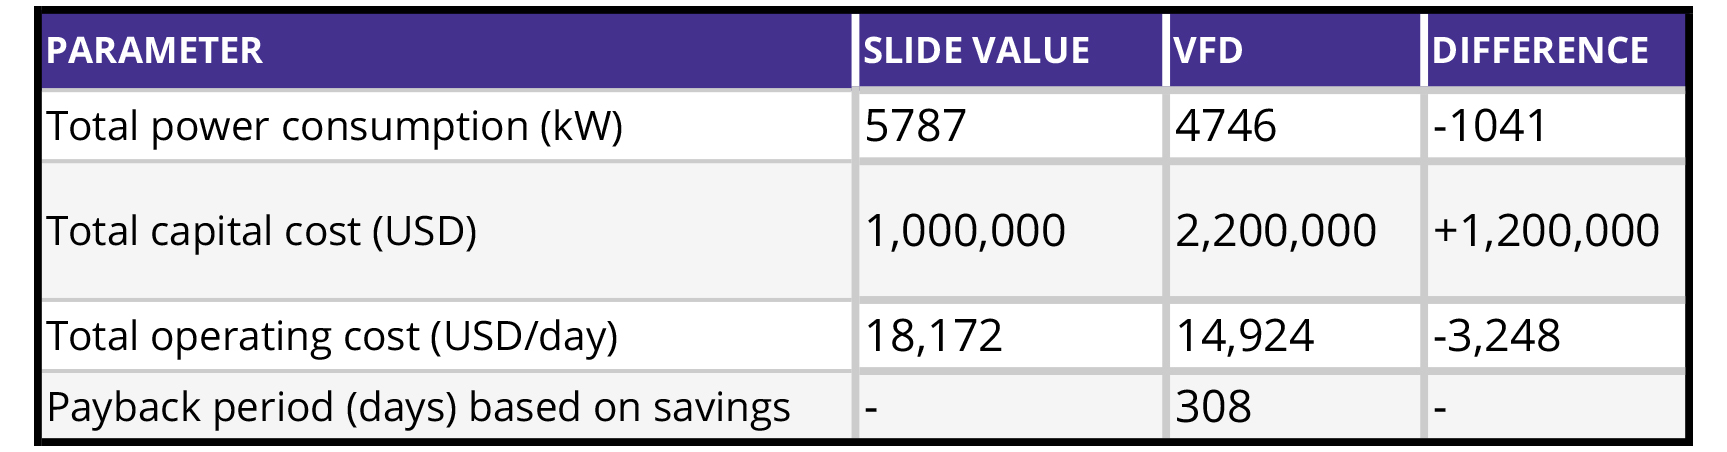
    The results of our analysis are summarized in the table below.

    table of data showing comparison of VFDs to slide valves

    As shown in the table, using VFDs to control the capacity of the screw compressors resulted in a 18% reduction in power consumption, compared to using slide valves. This translates to a 18% reduction in operating cost, which amounts to $3,248 USD per day in savings from lower power demands. On the other hand, using VFDs increased the capital cost of the screw compressors by 50%, which amounts to $1,000,000 USD.

    Impact on Facility Profits

    The results of our case study demonstrate that using VFDs to control the capacity of the screw compressors in CO2 liquefaction and capture facilities is economical if reduced capacity is anticipated.  What determines the economics will be the duration of the reduced operations and the CO2e of the kWh.

    Although VFDs have a higher capital cost than slide valves, the payback period of the VFDs is relatively short, as the operating cost savings are significant. Moreover, VFDs can help CO2 liquefaction and capture facilities achieve their environmental and social goals (45Z) as a low carbon fuel product, as they can reduce the greenhouse gas emissions and the energy intensity of the process.

    Conclusion: VFDs Offer Significant Benefits

    Are VFDs right for your facility?  Using VFDs on screw compressors for CO2 liquefaction facilities can offer significant benefits in terms of efficiency and cost savings, compared to using slide valves. VFDs can reduce the power consumption and the operating cost of the screw compressors by 18%. In a reduced operating scenario of 75%, the payback period of the VFDs is only 308 days. Additional revenue increases can be recognized as well based on the CO2e of the kWh used in the liquefaction, as it will affect the multiplier of the government credits for 45Z.

    Therefore, we recommend that when considering CO2 liquefaction, engineering should work to determine the anticipated average flow of CO2 product compared to the maximum capacity of the facility to determine the drive technology.

    *Article Reference: 26 U.S. Code § 45Z – Clean fuel production credit | U.S. Code | US Law | LII / Legal Information Institute (cornell.edu)

    CONNECT WITH CANUSA EPC 

    CANUSA EPC provides engineering, procurement, and construction management for CO2 liquefaction and capture facilities across North America.  We focus on aligning the processing requirements with operational strategies to optimize your return on investment in these facilities.  If you are interested, please contact us.

  • How the Producer Price Index Impacts the CANUSA Facility Index

    How the Producer Price Index Impacts the CANUSA Facility Index

    What is the Producer Price Index (PPI)?

    The Producer Price Index (PPI) is a measure of the average change in the prices received by domestic producers of goods and services. It is a leading indicator of inflation and reflects the cost pressures faced by businesses. The PPI covers various sectors of the economy, such as manufacturing, mining, agriculture, and utilities.

    At CANUSA, we keep track of relevant economic categories for industrial facilities, such as piping, valves, fittings, metal products, machinery, and electrical equipment. We use a weighted average of these categories to create the CANUSA Facility Index, which we believe accurately reflects the pricing changes of the industrial facility market in North America.

    Producer Price Index – April 2024

    The U.S. Bureau of Labor Statistics released the PPI for April 2024, which showed an increase of 2.2% (YoY) from the same month last year.

    Below are the month-over-month and year-over-year changes for our key categories, based on the data from the St. Louis Fed.

    Piping and manufacturing is continuing to keep the CANUSA Facility Index down year-over-year, recording a –1.97% change from last April.

    This is mainly due to the excess capacity and lower demand for oil and gas products, which are the main drivers of piping and manufacturing activity. Electrical equipment continued to increase this month and we see this trend continuing.


    CONNECT WITH CANUSA EPC 

    The CANUSA Facility Index is a valuable tool for our clients and partners, as it helps them monitor the market conditions and plan their projects accordingly. We update the index every month, based on the latest PPI data and our own analysis. If you want to learn more about the CANUSA Facility Index, or how we can help you with your industrial facility needs, please contact us.

  • Methane Reductions with the “Stick”

    Methane Reductions with the “Stick”

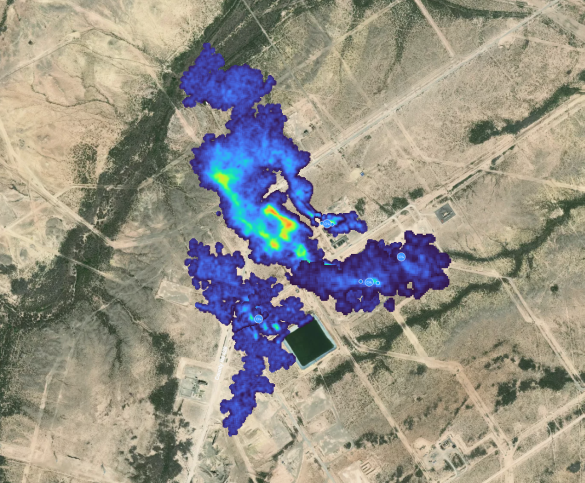
    The Methane Fee was created by the Inflation Reduction Act of 2022 (IRA). The IRA added a new Section 136 to the Clean Air Act (CAA) that set up the “Methane Emissions and Waste Reduction Incentive Program for Petroleum and Natural Gas Systems” and instructed the EPA to issue rules to calculate the charge and determine who qualifies for exemptions offered by the IRA. 

    Waste Emissions Fee (WEC) Explained 

    The EPA’s proposed  Methane Emissions Reduction Program could create substantial new annual costs for the oil and gas sectors starting in March 2025. In its Proposed Rule, the EPA explains how sources should estimate their asset’s emissions limit that triggers the per-ton charge for emissions above that limit. The new fee applies to nine categories of “applicable facilities” reporting more than 25,000 metric tons of carbon dioxide equivalent (CO2e) of greenhouse gas emissions under EPA’s Greenhouse Gas Reporting Rule, found in 40 CFR Subpart W: 

    • offshore petroleum and natural gas production  
    • onshore petroleum and natural gas production 
    • onshore natural gas processing 
    • onshore natural gas transmission compression 
    • underground natural gas storage 
    • liquified natural gas (LNG) storage 
    • LNG import and export equipment 
    • onshore petroleum and natural gas gathering and boosting 
    • onshore natural gas transmission pipelines 

    The statute defines three different levels for “applicable facilities” to determine the quantity of excess emissions used to compute the charge, mainly based on the proportion of natural gas delivered to a sales line or flowing through a facility. 

    Determine Your Facility Emissions Threshold 

    Based on the type of facility your operations qualify under, threshold calculations will be calculated based on the processing or production profile.  The below table is the current data available from the EPA. 

    Emissions Threshold Used to Calculate Fee 

    Facility Type Emission Standards 
    Onshore and offshore petroleum and natural gas production facilities Emissions that exceed 0.20% of natural gas sent to sale from the facility or 10 metric tons of methane per million barrels of oil sent to sale if no natural gas was sent to sale from the facility 
    Onshore natural gas processing, LNG storage, LNG import and export equipment, or onshore petroleum and natural gas gathering and boosting facilities Emissions that exceed 0.05% of the natural gas sent to sale “from or through” the facility 
    Onshore natural gas transmission compression, underground natural gas storage, or onshore natural gas transmission pipeline facilities Emissions that exceed 0.11% of the natural gas sent to sale “from or through” the facility 


    The EPA gave an example of how to calculate a threshold for an onshore oil or gas production facility that reports emitting 3,000 metric tons of methane: 

    • Waste emissions threshold = throughput x segment-specific intensity x density of CH4 
    • Waste emissions threshold = 60,000,000 Mscf x 0.002 x 0.0192 mt/Mscf 
    • Waste emissions threshold = 2.304 mt CH4 

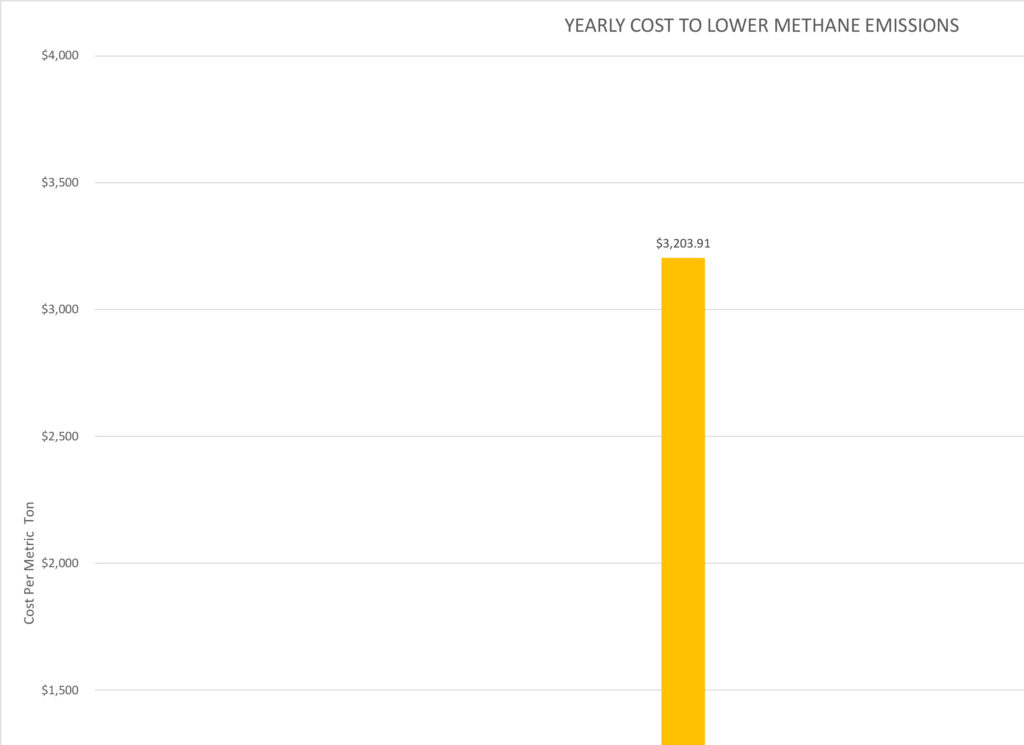
    The Cost of Methane 

    The fee structure for WEC will increase over the proposed schedule through 2027Operators should be planning for 2025 reporting of 2024 emissions under their Subpart W – GHG Reporting program. 

    Year Charge for Excess Emissions 
    2025 $900 per ton above waste emissions threshold for 2024 emissions 
    2026 $1,200 per ton above waste emissions threshold for 2025 emissions 
    2027 and beyond $1,500 per ton above waste emissions threshold for the preceding year’s emissions 

    Facilities must calculate and pay the WEC based on their emissions in the previous year by March 31, which coincides with the deadline for Subpart W annual reports to the EPA. For example, if the facility above emits 3,000 metric tons of methane in 2024, then it would surpass its threshold by 696 tons, and it would owe the EPA a $626,400 fee by March 31, 2025. EPA is seeking comments on whether the initial filing deadline should be delayed for the first reporting year. 

    This WEC structure on top of the new rules from 40 CFR Subpart OOOO – Subpart OOOO —Standards of Performance for Crude Oil and Natural Gas Facilities regarding methane venting will require operators to plan for increased spend on the reduction of methane emissions.  To stay up to speed on other emission regulation developments, download our USA Emissions Whitepaper. 

    CANUSA EPC understands that this will be an important part of discussion with clients for capital planning and we will be developing processes and tools to help clients stay informed and navigate this changing regulatory environmentVenture over to our codes and standard whitepaper to read about emissions reduction regulations in your area of operations or use our emissions reduction calculator to start determining the return on your investment while reducing your methane emissions. 

    Explore more resources