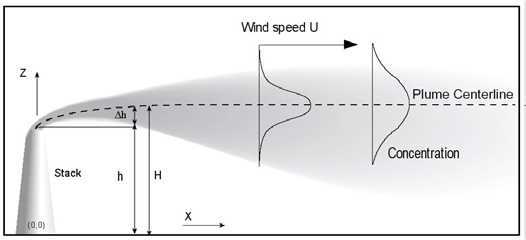
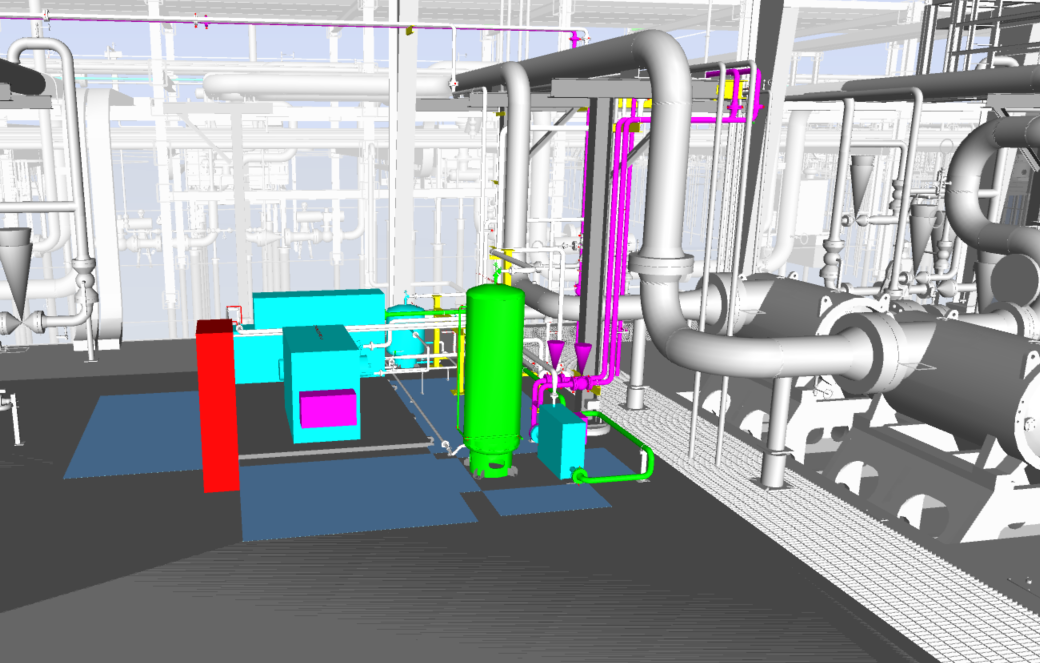
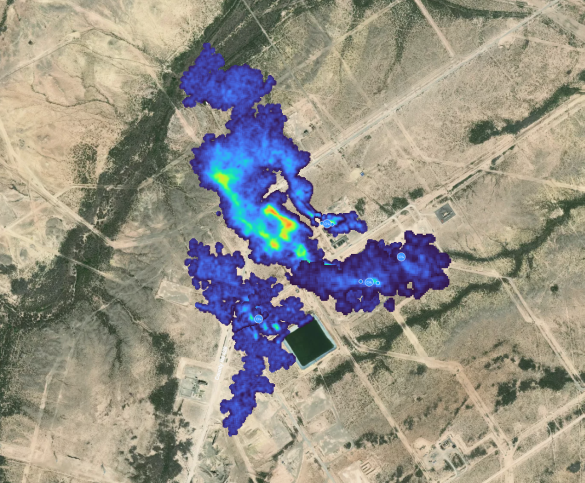
The Client was experiencing shutdown trips in their amine processing area from hydrogen sulfide sensors due to increased H2S in the inlet gas. During calm ambient conditions (e.g. no wind), the gas from the vent stack can migrate to grade and present safety concerns for the onsite operators and exceed the NIOSH REL and OSHA PEL 10-minute exposure limits.
The Solution
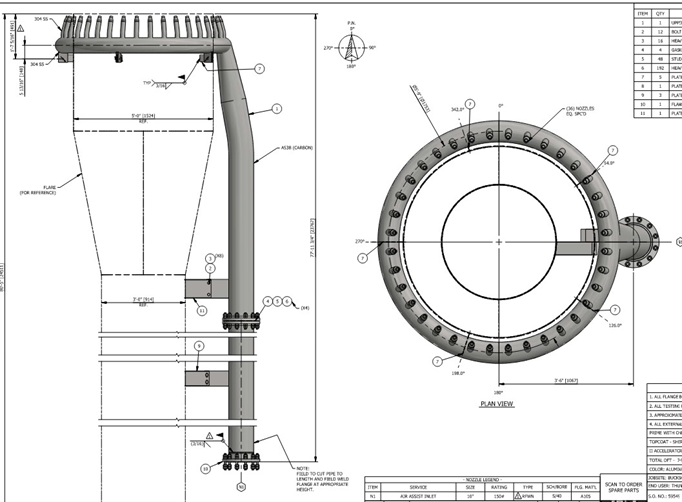
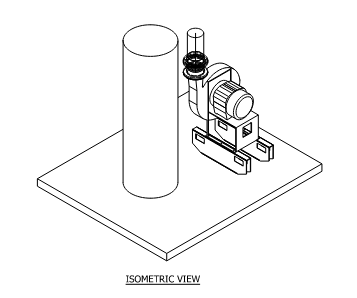
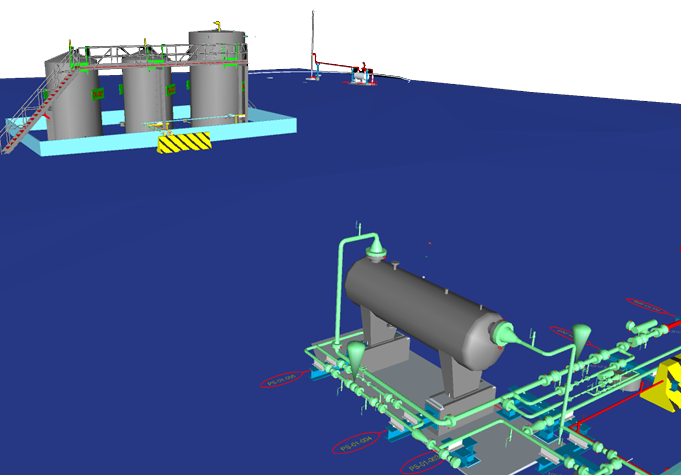
CANUSA EPC evaluated various options from thermal oxidizers, vent stack blowers, and H2S scavengers as solutions to reduce the instances where H2S was causing facility shutdowns. The solution selected was a modified blower vent tip system to increase the velocity of the exit gas to elevate the concentrated gas high enough to disperse to non-detectable levels by the time it reached safety sensors.
Engineering:
Blower specification
Dispersion modeling
Electrical system additions
Vent structural steel design for blower
Procurement:
VFD Specification
Blower package evaluation
Dispersion modeling
Construction package bids
The Results
Reduction in ground measurements of H2S exceeding the 20 ppm sensor shutdown
Reduced conditions where operators are exposed to H2S limits above OSHA
Mitigated instances of shutdown related to inadequate dispersion of H2S
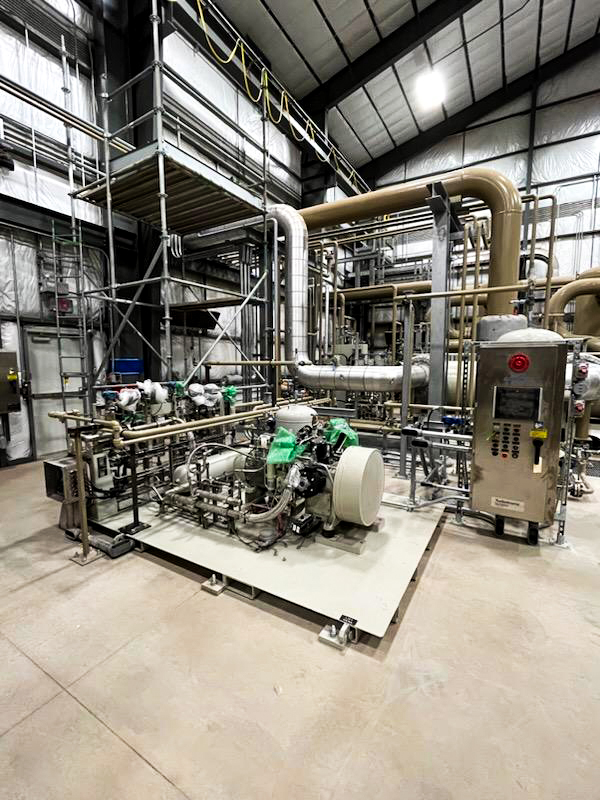
The Client agreed to mitigate emissions from turbine units seal gas system at one of their compression sites to satisfy an EPA consent decree regarding the Clean Air Act and the Colorado Air Pollution Prevention and Control Act. Per the terms of the agreement, the Client was required to install a seal gas capture system within 90 days of receiving the dry seal recompression unit.
The Solution
CANUSA EPC worked with the Client and packager of the dry seal recompression system to develop an engineering and design package for the installation of the system.
Multi-Discipline Engineering
Electrical tie-in of 40 HP Motor
PSV sizing for new relief scenarios
Piping modeling for discharge into plant inlet to recover the gas
Automation design to integrate with station controls
Procurement
VFD and Cable specification
Pressure Instrumentation
Construction Bid Walkdowns
The Results
Deployed the first seal gas system in the fleet
Installation of a single capture unit for seal gas of two turbine units
Reduction in fugitive methane emissions
Reduction in venting emissions of 49.3 mton of CO2e/day
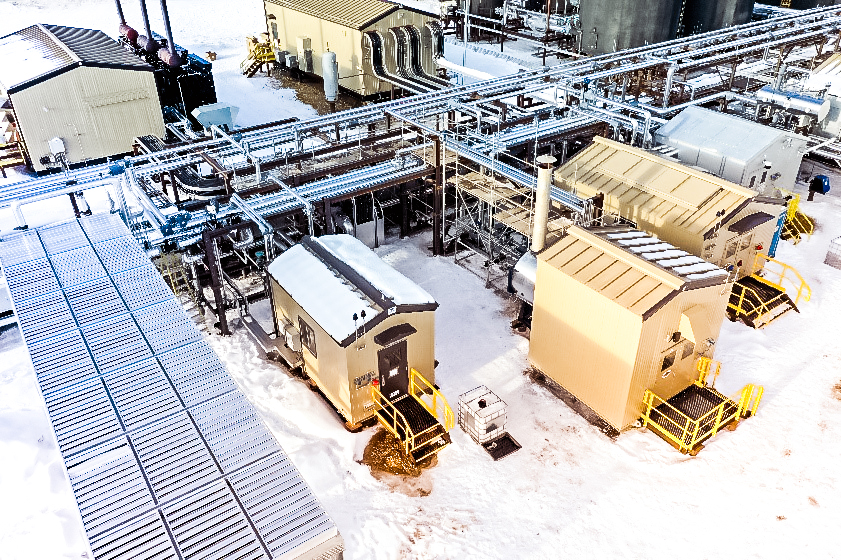
CANUSA EPC was tasked with adding heat trace (piping freeze protection) and building heat to a gas plant. It was noted that there was a large amount of waste heat being released into the atmosphere from cooling oil at the adjacent oil battery. The Client wanted to investigate if there were options to utilize this waste heat, reducing operating costs and GHG emissions. The heat source was provided at 60°C where typical glycol heating systems operate at a minimum of 90°C.
The Solution
The heat duty required for providing heat to the facility was approx. 3.5MMBTU/hr and the heat duty available from cooling the oil was 10MMBTU/hr. CANUSA EPC designed a unique system based on a proprietary calculation model to utilize the warm glycol exiting the oil cooler at 60°C.
Developing a Plan to Meet Client Expectations
Leveraged our in-house process and design experts
Developed and managed installation scope to meet existing project schedule
Sourced New Equipment:
Glycol boiler
Glycol cooler
Waste heat recovery building
Glycol pump
Glycol heat trace and supply/return manifolds
Glycol building heaters
Execute Value Engineering to Support the Project Schedule
Rigorous heat duty and heat transfer calculations to maximize efficiency
Hydraulic modeling of the GHT system
GHT and manifold isometrics to control costs of installation
The Results
Lowered emissions of the facilities
Eliminated 4.4 MTPD of CO2 equivalent emissions
Lowered annual facility operating costs
Estimated $100,000+ CDN/year OpEx savings
Integrated waste heat recovery
Designed and implemented a GHT system to operate with 60⁰C warm glycol
Understanding Alberta’s Industrial Power Landscape for the Next 20 Years.
How can industrial facilities stay ahead as power demand, electrification trends, and emissions regulations continue to evolve? This presentation, originally shared at APEGA 2025, examines the intersection of power planning, cost pressures, and regulatory expectations in Alberta and beyond.
Download the Industrial Power Distribution presentation to explore:
Projected power demand growth in Alberta under Reference vs. High Electrification scenarios (1.2%/yr vs. ~45% increase by 2043)
The impact of demand on cost per kWh, including capital investment implications
Emissions-reduction strategies needed to meet layered regulatory requirements
Natural gas generation outlook and where it fits in the evolving power mix
Planning considerations for scalable, flexible industrial facility power systems
This presentation is ideal for facility planners, energy infrastructure developers, and ESG leaders seeking to understand how demand and regulatory expectations will influence future power costs, project timelines, and infrastructure strategies
Understanding Methane Regulations In Energy Production
Summary
Canada’s commitment to environmental stewardship is reflected in its methane emission regulations, aimed at significantly reducing emissions from the oil and gas sector. The latest amendments to the regulations set a bold target to cut methane emissions by at least 75% from 2012 levels by 2030.
Provincial efforts complement the federal regulations through equivalency agreements that must align with or exceed federal standards. These agreements allow provinces to implement tailored strategies that address specific regional challenges associated with methane emissions.
This guide is provided with the intention to bring clarity to the regulations that impact your operations, providing a clear and concise overview that aids understanding and compliance.
This Canadian Methane Emissions guide includes:
Overview of methane regulations (2023 data)
Federal regulation overview for Canada
Key provincial regulations for Western Canadian operators
Understanding Methane Regulations In Energy Production
Summary
The US government has taken decisive steps to combat methane pollution. Navigating the maze of emissions regulations in the North American oil and gas sector can be a daunting task, even for the most seasoned professionals.
This guide was created with the intention to bring clarity to the regulations, such as OOOO(b) that impact your operations, providing a clear and concise overview that aids understanding and compliance on USA methane emissions.
This USA methane emissions guide includes:
Overview of current state of methane regulations (key 2023 data)
Gas compression facilities in the USA must adapt to the EPA’s latest methane regulations (Final Rule1), Subpart OOOO(b), which mandate significant reductions in methane emissions from key equipment. Executing emission reduction projects presents opportunities to leverage a strategic approach to engineering, procurement, and construction (EPC) to maintain cost efficiency.
What is OOOO(b) Compliance?
The EPA’s OOOO(b) Rule is a major regulatory update aimed at curbing methane emissions from oil and gas operations. The EPA’s Rule mandates “strict performance standards for new, modified, and reconstructed sources”.
For gas compression facilities, compliance requires a shift in operational practices. There are three distinct applications that apply:
Process Controllers & Pneumatic Pumps – Natural gas-driven controllers and pneumatic pumps, which historically vented methane into the atmosphere, must be replaced with zero-emission alternatives (IE. instrument air-driven controllers).
Dry Seals for Compressors – Dry-seal centrifugal compressors must maintain a volumetric flow rate at or below 10 standard cubic feet per minute (scfm) per compressor seal to minimize emissions.
Storage Vessels/Tank Batteries – Storage tanks at compression stations must now achieve a 95% reduction in methane and VOC emissions, significantly changing how operators manage emissions control systems.
Compliance Dates with EPA 40 CFR Part 60, Subpart OOOO?
Originally published in December 2023, EPA’s Final Rule(1) provided lead time for industry to comply. This subpart establishes emission standards and compliance schedules for the control of volatile organic compounds (VOC) and sulfur dioxide (SO2) emissions from affected oil and gas facilities that commence construction, modification, or reconstruction after December 6, 2022.
Compliance with the new performance standards is stated in section 60.5370b2. “You must be in compliance with the standards of this subpart no later than May 7, 2024, or upon initial startup, whichever date is later, except as specified per….”
This deadline has forced operators to focus on upgrades in an accelerated manner. With the right plan in place, you can realize cost savings and operational efficiencies.
Instrument Air Conversions: Save Time & Money
Converting from instrument gas to instrument air across multiple sites is a capital-intensive process. In a recent methane reduction project, CANUSA EPC achieved substantial cost savings and accelerated schedule for their operator using these strategies.
Develop a Compliance Program Team
Project Manager, Josh Hoeft, explains “the most cost-effective approach is to develop a Compliance Program – a structured, regional approach where you select a preferred EPC firm, issue a bulk order on IA package for volume discounting and guaranteed delivery schedules, and contract a regional construction firm familiar with the sites. This eliminates redundancies, reduces costs, and streamlines your path to compliance.”
Template-Based Engineering
“Experienced EPCs should be utilizing a template-based approach to engineering – a copy-paste design format across facilities. This approach:
expedites execution,
minimizes engineering re-work, and
ensures uniformity in documentation for installation
At CANUSA EPC, we’ve realized reduced engineering costs by up to 25% per site when we execute a Compliance Program on multiple sites (as compared to a single site),” says Hoeft.
Package Negotiations
Bulk procurement of IA systems can result in total project cost reductions of 10%. A Compliance Program recognizes savings on the purchase price of equipment, and the schedule for delivery can also be staggered – allowing the engineering and construction team to streamline their engagements to reduce demobilization costs.
Lessons learned from the first or second installation are incorporated into the execution plan. Every future installation becomes more efficient, creating a ‘snowball effect’. When executing multiple sites concurrently, you do not realize these benefits.
Single-Sourced Contractor
Having a dedicated contractor on multiple sites will improve efficiencies for scope development and allow the contractor to remove risk from their estimates, resulting in site costs that finish on budget. Contractors can develop a plan to support operations and minimize downtime, which often is the largest cost for these compliance projects – missed operating revenue.
OOOO(b) Planning & Operational Efficiencies
From past compliance projects, CANUSA EPC has found critical execution aspects that impact schedule and add risk to project costs.
Engaging Utilities Early
Electrical power capacity and availability must be analyzed early. This determines whether the existing electrical infrastructure (on site and from the utility) can accommodate the new loads required for OOOO(b) projects.
Electrical utilities are often backlogged. Requesting new/upgraded services or electrical equipment, like transformers, can result in long and unexpected lead items. It can take several months for the local power provider to run a new power line or install a new bucket transformer if the utility is the limiting factor.
Engaging utilities early in the design process can prevent significant delays.
Involve Site Operations in Design
From an engineering perspective, early and continuous engagement with operations personnel is critical. Facility staff possess in-depth knowledge of site-specific factors – existing infrastructure, space constraints, and potential integration challenges. Their input optimizes pipe routing, equipment placement, and ensures IA systems are designed with future facility expansions in mind.
Since operators are responsible for routine inspections and emissions monitoring, their early input ensures new systems are both practical and sustainable.
If your EPC is not involving your operations team from the outset, you may lose foresight on site functionality, long-term maintenance, and accessibility. Collaboration also helps your EPC understand operational priorities, reducing the risk of installing systems that require extensive modifications after deployment.
Planning for Reduced Downtime and Increased Reliability
Facility outages and prolonged downtime affect your bottom line. Engaging operations will plan for final mechanical tie ins and reduce facility downtime. On-site staff are knowledgeable about which equipment is critical for continued operation and can provide tie in plans that may avoid a facility shutdown.
If electrical tie ins require energy isolation, affecting critical equipment like the station PLC, developing a temporary power plan using a generator can be a viable option to keep the station running during the tie ins.
Abnormal operation of natural gas facilities – during start-ups and shutdowns – present the most hazardous operating scenarios when compared to steady state operation. Avoiding facility shutdowns altogether helps mitigate unsafe operating conditions.
Long-Term Benefits and Regulatory Compliance
For gas compression facilities, the implementation of OOOO(b) compliance measures satisfies regulatory requirements and creates opportunities for operational efficiencies. Companies that invest in structured IG-to-IA conversion programs, bulk material procurement, and standardized engineering designs will benefit from reduced compliance costs, improved environmental performance, and increased asset reliability.
Moving Forward with Compliance
Are you confident about what deadlines apply to your facilities?
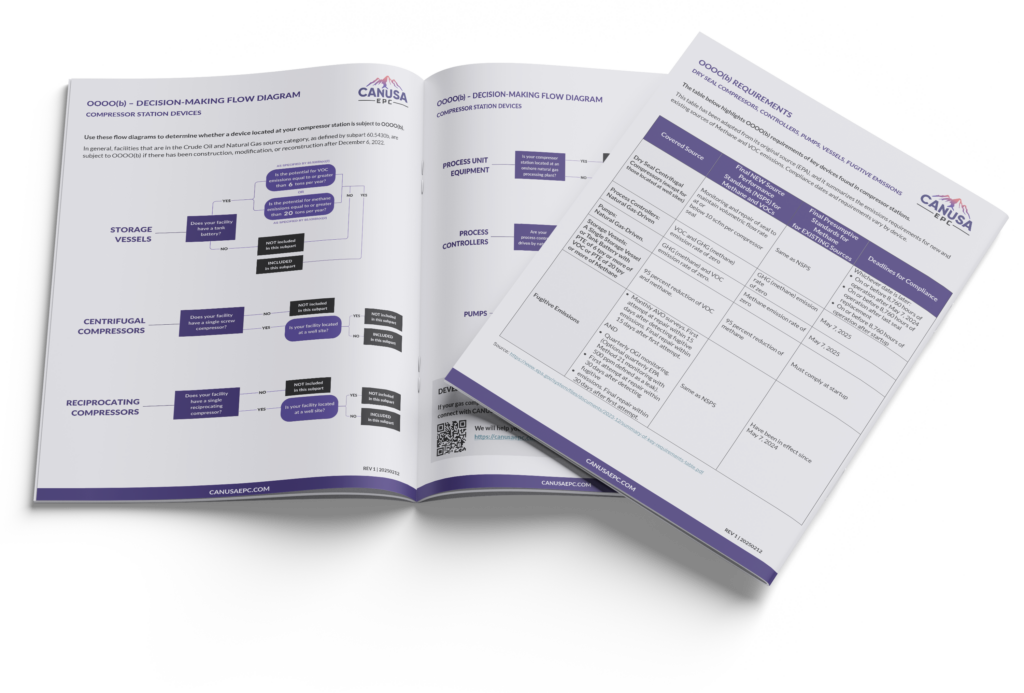
CANUSA EPC has created a OOOO(b) Guide to help you gain clarity on what EPA Methane Rules apply to your compression operations.
Simplified EPA Matrix focusing only on dry seals, pumps, storage vessels, fugitive emissions, and process controllers.
Decision-making diagrams to guide you on what OOOO(b) sub-rules are pertinent – dry seal venting of centrifugal compressors, gas pneumatic devices, fugitive emissions, storage vessel, and pumps.
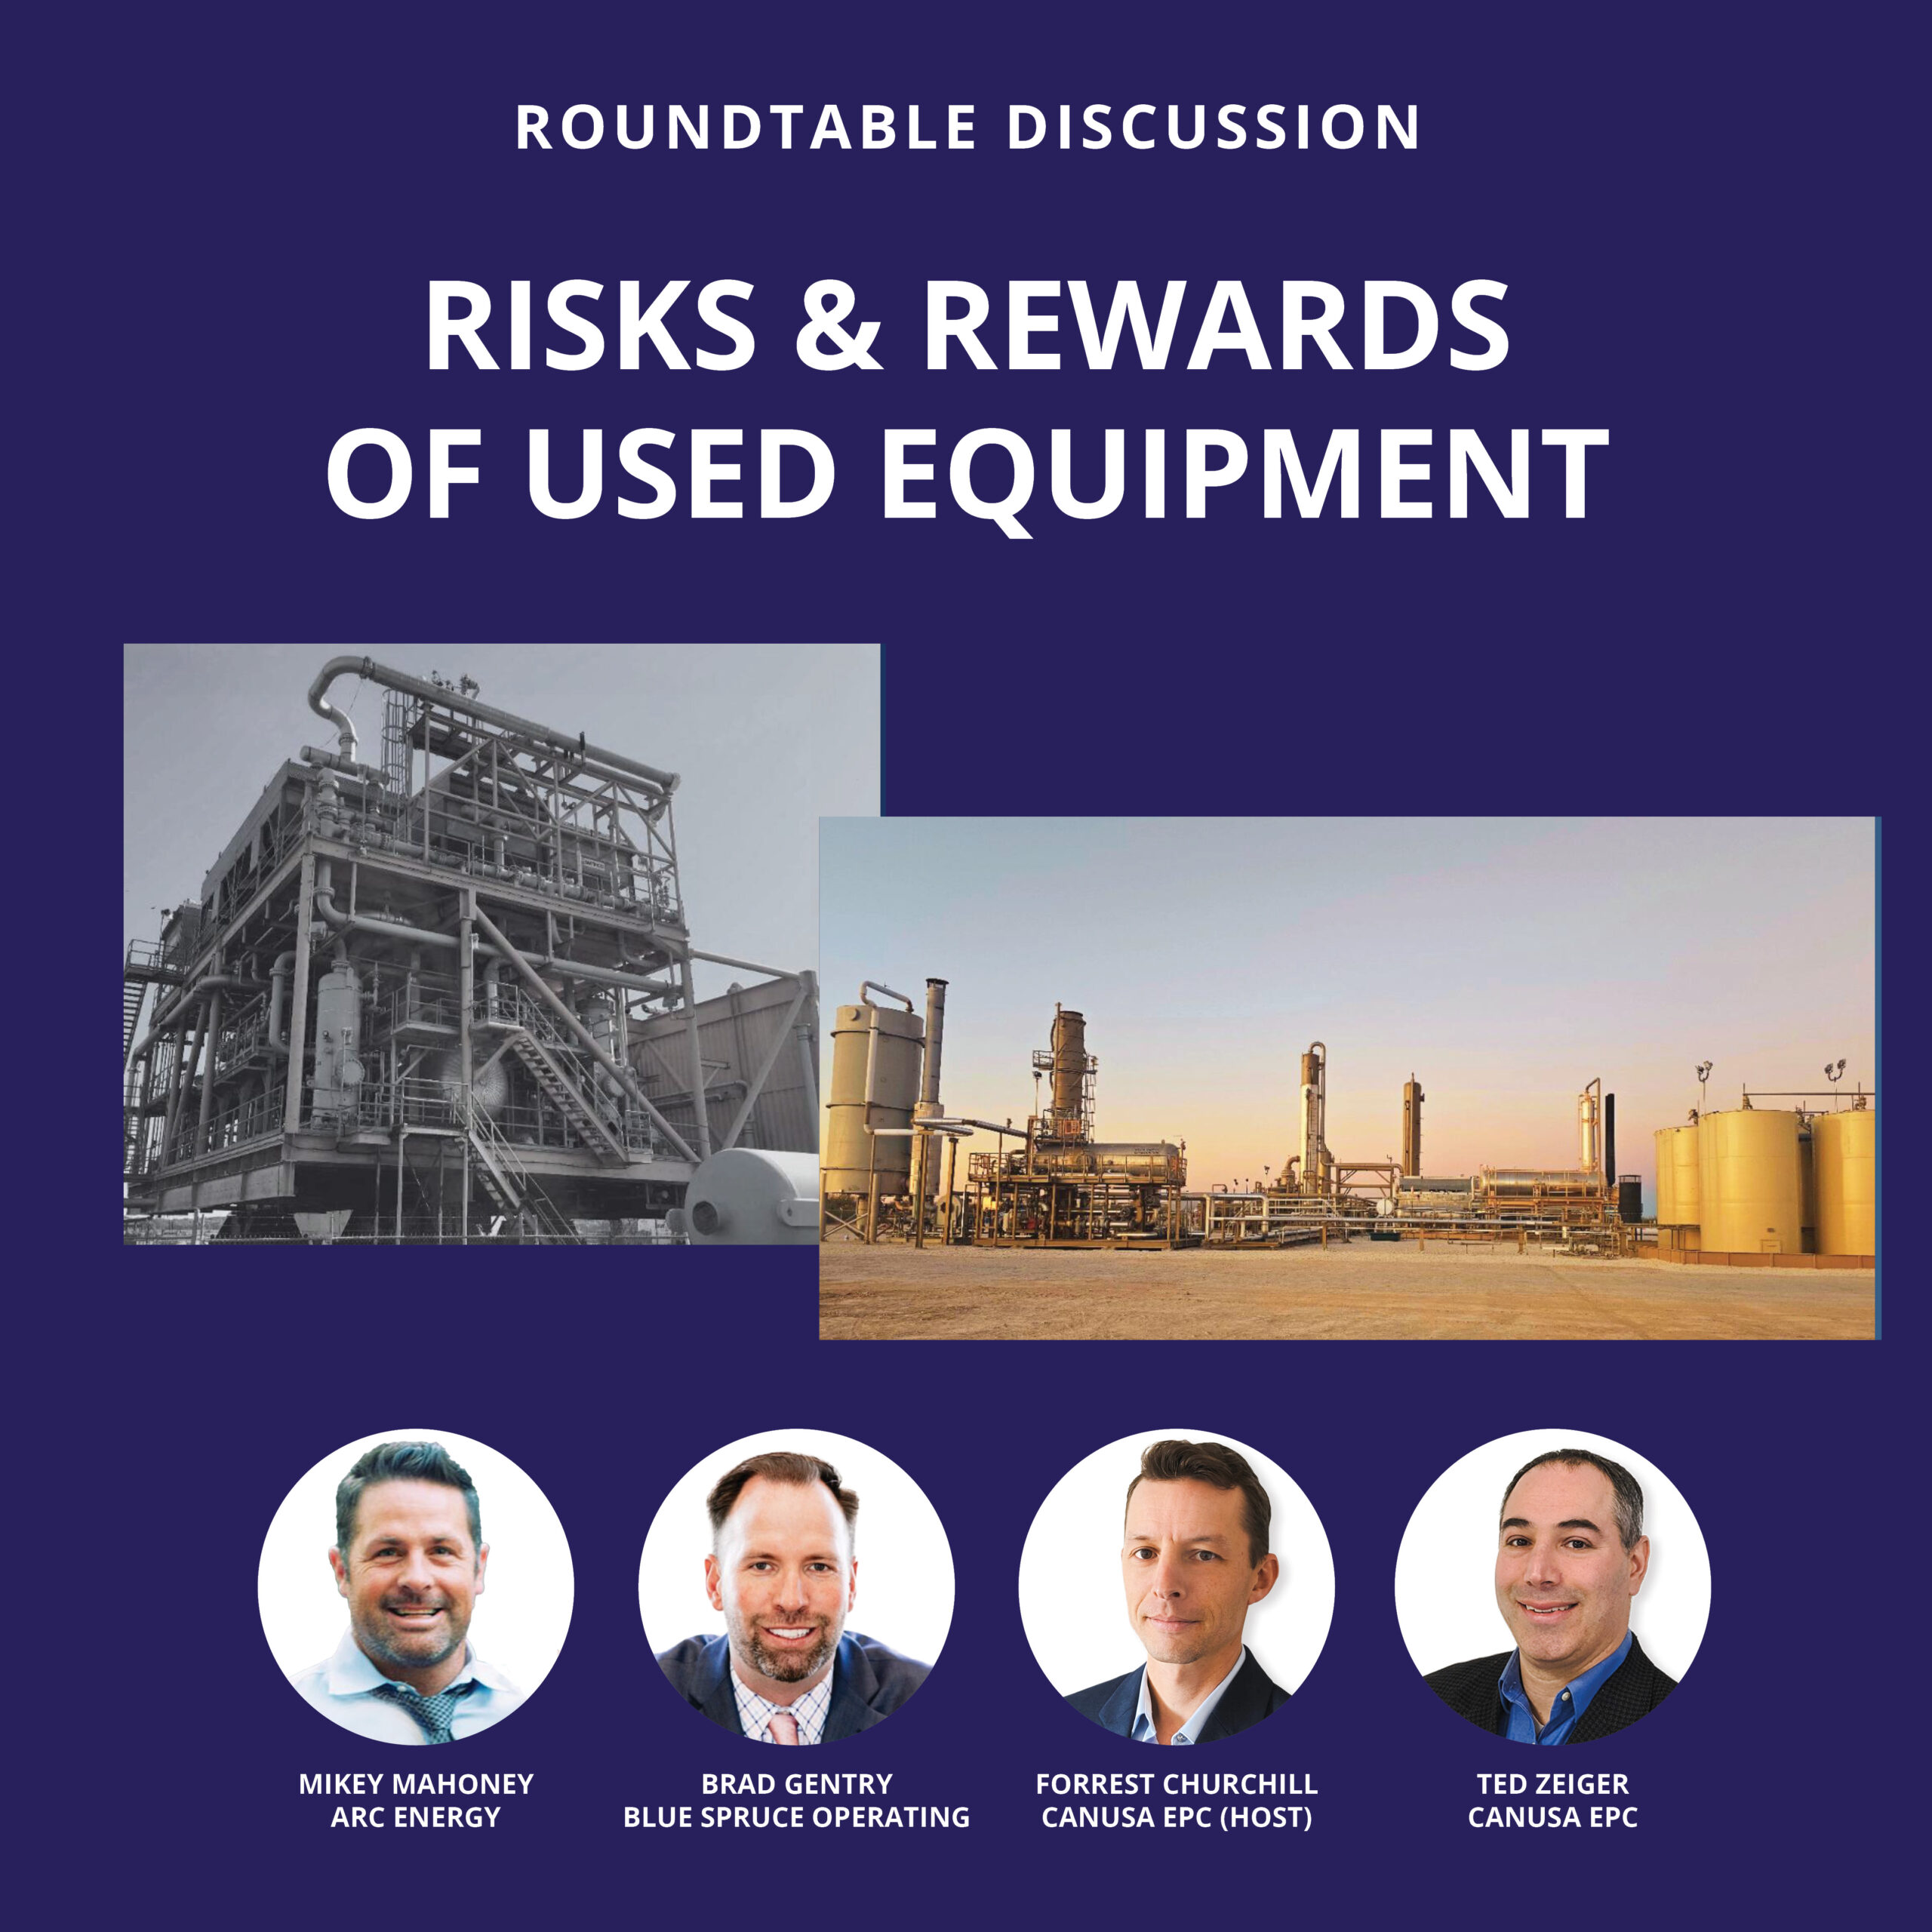
Repurposing used or reconditioned equipment can expedite schedules and reduce costs; it can also cause drastic problems if not executed correctly. We assembled an expert panel to answer all of your questions on leveraging used equipment. Topics covered: mechanical integrity approaches, key evaluation metrics, considerations for the impact of reconditioning equipment for PSM programs, and more.
The Methane Fee was created by the Inflation Reduction Act of 2022 (IRA). The IRA added a new Section 136 to the Clean Air Act (CAA) that set up the “Methane Emissions and Waste Reduction Incentive Program for Petroleum and Natural Gas Systems” and instructed the EPA to issue rules to calculate the charge and determine who qualifies for exemptions offered by the IRA.
Waste Emissions Fee (WEC) Explained
The EPA’s proposed Methane Emissions Reduction Program could create substantial new annual costs for the oil and gas sectors starting in March 2025. In its Proposed Rule, the EPA explains how sources should estimate their asset’s emissions limit that triggers the per-ton charge for emissions above that limit. The new fee applies to nine categories of “applicable facilities” reporting more than 25,000 metric tons of carbon dioxide equivalent (CO2e) of greenhouse gas emissions under EPA’s Greenhouse Gas Reporting Rule, found in 40 CFR Subpart W:
offshore petroleum and natural gas production
onshore petroleum and natural gas production
onshore natural gas processing
onshore natural gas transmission compression
underground natural gas storage
liquified natural gas (LNG) storage
LNG import and export equipment
onshore petroleum and natural gas gathering and boosting
onshore natural gas transmission pipelines
The statute defines three different levels for “applicable facilities” to determine the quantity of excess emissions used to compute the charge, mainly based on the proportion of natural gas delivered to a sales line or flowing through a facility.
Determine Your Facility Emissions Threshold
Based on the type of facility your operations qualify under, threshold calculations will be calculated based on the processing or production profile. The below table is the current data available from the EPA.
Emissions Threshold Used to Calculate Fee
Facility Type
Emission Standards
Onshore and offshore petroleum and natural gas production facilities
Emissions that exceed 0.20% of natural gas sent to sale from the facility or 10 metric tons of methane per million barrels of oil sent to sale if no natural gas was sent to sale from the facility
Onshore natural gas processing, LNG storage, LNG import and export equipment, or onshore petroleum and natural gas gathering and boosting facilities
Emissions that exceed 0.05% of the natural gas sent to sale “from or through” the facility
Onshore natural gas transmission compression, underground natural gas storage, or onshore natural gas transmission pipeline facilities
Emissions that exceed 0.11% of the natural gas sent to sale “from or through” the facility
The EPA gave an example of how to calculate a threshold for an onshore oil or gas production facility that reports emitting 3,000 metric tons of methane:
Waste emissions threshold = throughput x segment-specific intensity x density of CH4
Waste emissions threshold = 60,000,000 Mscf x 0.002 x 0.0192 mt/Mscf
Waste emissions threshold = 2.304 mt CH4
The Cost of Methane
The fee structure for WEC will increase over the proposed schedule through 2027. Operators should be planning for 2025 reporting of 2024 emissions under their Subpart W – GHG Reporting program.
Year
Charge for Excess Emissions
2025
$900 per ton above waste emissions threshold for 2024 emissions
2026
$1,200 per ton above waste emissions threshold for 2025 emissions
2027 and beyond
$1,500 per ton above waste emissions threshold for the preceding year’s emissions
Facilities must calculate and pay the WEC based on their emissions in the previous year by March 31, which coincides with the deadline for Subpart W annual reports to the EPA. For example, if the facility above emits 3,000 metric tons of methane in 2024, then it would surpass its threshold by 696 tons, and it would owe the EPA a $626,400 fee by March 31, 2025. EPA is seeking comments on whether the initial filing deadline should be delayed for the first reporting year.
This WEC structure on top of the new rules from 40 CFR Subpart OOOO – Subpart OOOO —Standards of Performance for Crude Oil and Natural Gas Facilities regarding methane venting will require operators to plan for increased spend on the reduction of methane emissions. To stay up to speed on other emission regulation developments, download our USA Emissions Whitepaper.
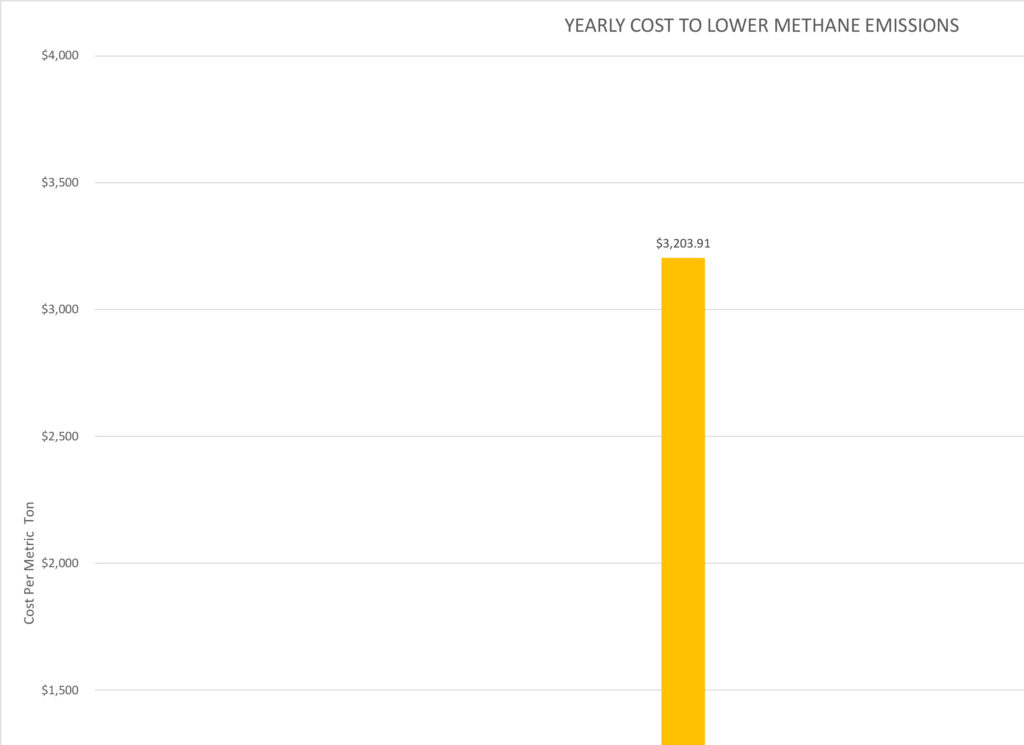
CANUSA EPC understands that this will be an important part of discussion with clients for capital planning and we will be developing processes and tools to help clients stay informed and navigate this changing regulatory environment. Venture over to our codes and standard whitepaper to read about emissions reduction regulations in your area of operations or use our emissions reduction calculator to start determining the return on your investment while reducing your methane emissions.